This is where I'm getting this data from.
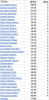
NFL Team Spending Against the Cap By Position (full roster)
QB
- NFL Avg - $15.3m
- High: Tennessee - $39.5m
- Low: Tampa Bay - $3.2m
- New England: #30 - $6.1m
RB
- NFL Avg - $10.0m
- High: Las Vegas - $20.1m
- Low: LA Rams - $3.8m
- New England: #31 - $4.0m
WR
- NFL Avg - $22.1m
- High: Tampa Bay - $39.2m
- Low: Green Bay - $6.9m
- New England: #15 - $21.7m
TE
- NFL Avg - $9.7m
- High: New England - $20.9m
- Low: Tennessee - $2.6m
- New England: #1 - $20.9m
OL
- NFL Avg - $36.9m
- High: Houston - $58.7m
- Low: Tennessee - $18.2m
- New England: #15 - $36.9m
DL
- NFL Avg - $32.0m
- High: Washington - $60.9m
- Low: Arizona - $9.6m
- New England: #18 - $29.3m
LB
- NFL Avg - $22.1m
- High: LA Chargers: $44.5m
- Low: LA Rams: $4.9m
- New England: #7 - $32.2m
DB
- NFL Avg - $30.0m
- High: Buffalo - $50.2m
- Low: LA Rams - $10.6m
- New England: #7 - $34.7m
K/P/LS
- NFL Avg - $5.4m
- High: Kansas City - $9.1m
- Low: LA Rams - $2.0m
- New England: #28 - $3.2m
So New England isn't investing much $ in the QB, RB, and ST positions. They are investing a lot of $ in the LB, DB, and TE positions. They're average in spending at the WR, OL, and DL positions.
The Patriots - in terms of spending against the cap - are spending more $$ this year at the WR position than KC, Dallas, Philly, San Fran, Balt, Min, and Det, to name a few. So spending at that position isn't really the issue. It's that they've spent it on the wrong guys.
But it's not like they're not TRYING to get better there.
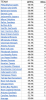