How good are Fangraphs Predictions (2023 Edition)

RS2004foreever

Member
SoSH Member
Dec 15, 2022
671
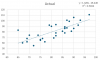
I went back and looked at the projections at the start of 2023 and compared them to the actual results.

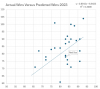
On average the Fangraphs projection missed by 9 games. The largest misses were:
Orioles - 24 games
A's - 20 games
White Sox 19 games
Royals 17 games
Mets 16 games

The R squared was REALLY not very predictive.
Baseball is very unpredictable, and we don't know who is going to win.
80046
 

simplicio

Member
SoSH Member
Apr 11, 2012
5,298
I wonder if anyone does this for their player predictions. I think those are even more nonsense.
 

Rice4HOF

Member
SoSH Member
Jan 21, 2002
1,900
Calgary, Canada
An average miss by 9 games is quite bad. If you had just picked every team to go 81-81, your average miss would be 10, so Fangraphs was barely better than having someone who knows absolutely nothing about baseball do the forecast. I'll run an R2 analyzes soon.
 
Last edited:

nvalvo

Member
SoSH Member
Jul 16, 2005
21,692
Rogers Park
I wonder sometimes if it would make sense to evaluate these things at the trade deadline.

You might sometimes have teams that are projected to contend, say, but they start slow and drift out of contention. If they end up trading a bunch of departing FAs, that choice to sell could turn a mild projection miss into a massive one. Is that data anywhere?
 

Petagine in a Bottle

Member
SoSH Member
Jan 13, 2021
12,317
An average miss by 9 games is quite bad. If you had just picked every team to go 81-81, your average miss would be 10, so Fangraphs was barely better than having someone who knows absolutely nothing about baseball do the forecast. I'll ran an R2 analyzes soon.
Isnt that what they basically do? They have like 75% of teams winning between 76-86 games.
 

RS2004foreever

Member
SoSH Member
Dec 15, 2022
671
An average miss by 9 games is quite bad. If you had just picked every team to go 81-81, your average miss would be 10, so Fangraphs was barely better than having someone who knows absolutely nothing about baseball do the forecast. I'll ran an R2 analyzes soon.
It's on the chart - the R squared is .3 - really low.
 

scottyno

late Bloomer
SoSH Member
Dec 7, 2008
11,342
I wonder sometimes if it would make sense to evaluate these things at the trade deadline.

You might sometimes have teams that are projected to contend, say, but they start slow and drift out of contention. If they end up trading a bunch of departing FAs, that choice to sell could turn a mild projection miss into a massive one. Is that data anywhere?
They have day by day season win total projections that factor in injuries and trades so the data is out there.

This was the projected win loss the day after the 2023 trade deadline. Looks like in theory someone could go back to 2016 if they wanted to.
https://www.fangraphs.com/standings/playoff-odds?date=2023-08-02&dateDelta=
 

effectivelywild

Member
SoSH Member
Jul 14, 2005
466
One thing that is interesting (at least to me)----their sub .500 predictions for teams have a fairly reasonable trend line (although I'm only talking about ~10 teams with one huge positive and negative outlier)---but once you get beyond that the numbers just explode all over the place.

But if you look at just those bottom 10 teams, you would probably have a much better R squared. And conversely, if you look at the teams above that....almost no correlation. Seems like their predictions are better about bad teams being bad than mediocre-to-good teams performing at that level.
 

slamminsammya

Member
SoSH Member
Jul 31, 2006
9,425
San Francisco
Thanks. I meant R squared for the methodology where you just pick everyone to win 81 games. My possibly flawed analysis showed that one had a value of 0.00, so fangraphs was at least slightly better.
Lemme chime in here, if you predict the population mean for every data point the R^2 will always be 0, since the variance of the residuals is exactly the variance of the population in that case.

So yes, R^2 is 0 if you predict 81 for every single team.
 

pokey_reese

Member
SoSH Member
Jun 25, 2008
16,316
Boston, MA
Following up on Slammin's point, you also generally want to create a dummy or 'null' model to compare the accuracy of your predictions against. One option would be 81-81 (in this case, that's the 'null' model), but also the previous year's record, the previous year's record averaged with 81-81, etc. The point being, you want to validate the fact that the variables you are using in your prediction actually provide additional information, rather than just noise, especially given a situation like baseball team records, where your sample size is going to be very small.

Also, a very minor point, but correlation isn't generally the best method of evaluating in case like this. We don't really have enough data points for it to matter that much. In an ordered series where points are not independent (since teams play eachother), we might prefer to use Spearman (rank) correlation, which is a non-parametric measure of correlation, which is preferred in cases like this, where one or both of the distributions can be significantly non-normal (since the actual winning percentage should be normal, i.e., symmetrical around 81-81), while the predictions don't have to be. The reason for the difference is that, using Pearson's metric, the outliers get much more influence, even though the bulk of the data is much more strongly correlated.
 

slamminsammya

Member
SoSH Member
Jul 31, 2006
9,425
San Francisco
Following up on Slammin's point, you also generally want to create a dummy or 'null' model to compare the accuracy of your predictions against. One option would be 81-81 (in this case, that's the 'null' model), but also the previous year's record, the previous year's record averaged with 81-81, etc. The point being, you want to validate the fact that the variables you are using in your prediction actually provide additional information, rather than just noise, especially given a situation like baseball team records, where your sample size is going to be very small.

Also, a very minor point, but correlation isn't generally the best method of evaluating in case like this. We don't really have enough data points for it to matter that much. In an ordered series where points are not independent (since teams play eachother), we might prefer to use Spearman (rank) correlation, which is a non-parametric measure of correlation, which is preferred in cases like this, where one or both of the distributions can be significantly non-normal (since the actual winning percentage should be normal, i.e., symmetrical around 81-81), while the predictions don't have to be. The reason for the difference is that, using Pearson's metric, the outliers get much more influence, even though the bulk of the data is much more strongly correlated.
nerd

do any of these models predict run differential as a side effect or do they just directly try to regress wins?
 

jon abbey

Shanghai Warrior
Moderator
SoSH Member
Jul 15, 2005
71,219
The Yankees added Jon Berti today who has had 2.4 bWAR each of the last two seasons and is a perfect positional fit for NY’s current needs, in exchange for Ben Rortvedt, a third catcher out of options with a .489 career OPS (plus a minor leaguer). NY’s Fangraphs projected team WAR dropped 0.1.
 

billy ashley

Member
SoSH Member
Jul 15, 2005
1,233
Washington DC
The Yankees added Jon Berti today who has had 2.4 bWAR each of the last two seasons and is a perfect positional fit for NY’s current needs, in exchange for Ben Rortvedt, a third catcher out of options with a .489 career OPS (plus a minor leaguer). NY’s Fangraphs projected team WAR dropped 0.1.
I agree with you that the Yankees are a better team with Berti (brave stance, I know).

But could the fangraphs projection be off due to not fully understanding/anticipating how the Yankees will deploy him? He's a quality player but a lot of his value comes from being incredibly versatile. It's hard to guess when and where he'll play and how often and to whose expense (like it's a bad thing if he's playing a ton instead of Volpe or Torres for example).
 

jon abbey

Shanghai Warrior
Moderator
SoSH Member
Jul 15, 2005
71,219
I agree with you that the Yankees are a better team with Berti (brave stance, I know).

But could the fangraphs projection be off due to not fully understanding/anticipating how the Yankees will deploy him? He's a quality player but a lot of his value comes from being incredibly versatile. It's hard to guess when and where he'll play and how often and to whose expense (like it's a bad thing if he's playing a ton instead of Volpe or Torres for example).
It’s just a very specific example of those predictions being pretty worthless if you dig in at all. I spend way too much time looking at that page, when really their main utility is in a very general sense, ‘how’s my team positioned currently?’ They overrate NY and underrate TB (and now BAL) seemingly every season, I wouldn’t bitch except it’s the exact question this thread is asking.
 

RS2004foreever

Member
SoSH Member
Dec 15, 2022
671
Following up on Slammin's point, you also generally want to create a dummy or 'null' model to compare the accuracy of your predictions against. One option would be 81-81 (in this case, that's the 'null' model), but also the previous year's record, the previous year's record averaged with 81-81, etc. The point being, you want to validate the fact that the variables you are using in your prediction actually provide additional information, rather than just noise, especially given a situation like baseball team records, where your sample size is going to be very small.

Also, a very minor point, but correlation isn't generally the best method of evaluating in case like this. We don't really have enough data points for it to matter that much. In an ordered series where points are not independent (since teams play eachother), we might prefer to use Spearman (rank) correlation, which is a non-parametric measure of correlation, which is preferred in cases like this, where one or both of the distributions can be significantly non-normal (since the actual winning percentage should be normal, i.e., symmetrical around 81-81), while the predictions don't have to be. The reason for the difference is that, using Pearson's metric, the outliers get much more influence, even though the bulk of the data is much more strongly correlated.
The null model - total absolute error is 300 versus 273 for fangraphs, so the average error is 10 versus 9.1. IOW predicting every team to be 81-81 is about as accurate as fangraphs is.
 

NoXInNixon

Member
SoSH Member
Mar 24, 2008
5,339
I wonder sometimes if it would make sense to evaluate these things at the trade deadline.

You might sometimes have teams that are projected to contend, say, but they start slow and drift out of contention. If they end up trading a bunch of departing FAs, that choice to sell could turn a mild projection miss into a massive one. Is that data anywhere?
But I think that factor should be accounted for in the reason pre-season projections aren't accurate. Some teams will overachieve their "true talent level", if there even is such a thing. That overachievement will make it more likely they will add talent at the deadline, making them even bigger overachievers. And, as we've seen in Boston recently, an underachieving team will unexpectedly sell, leading to an even worse September than could possibly have been projected.

The ultimate conclusion is that nobody really knows what teams will be good or bad. So let's be optimistic. Maybe the Sox will make the playoffs!
 

Rwillh11

Member
SoSH Member
Apr 23, 2010
227
I the discussion here has been somewhat uncharitable to Fangraphs. R^2 of .3 is not amazing, although as a social scientist I'm reading papers doing prediciton with lower R^2 in top academic journals all the time. More damning is the fact that it's barely doing better than a null model. But, this is only 30 datapoints, and it looks like a decent fit with 4 outliers. I'd be curious if 2023 is representative of a normal year for them and what their model looks like over several seasons. It's really easy to end up with a bad draw of 30 predictions because you have some bad injury luck, a team wildly outperforms it's pythag, or teams give up and sell off at the deadline. It's possible that the model is actually pretty bad, but 30 predictions is not enough to be confident.

I'm curious where I can find that data. I don't see the 2023 preseason predictions on FG anymore, but googling came up with these: https://dailyhive.com/vancouver/mlb-standings-2023-predictions-fangraphs, which seem different (maybe from a different date?)
 
Last edited:

Benj4ever

New Member
Nov 21, 2022
367
Statistical analyses substitute the Student's T distribution with the Standard Normal Distribution at n = 30, so there is that.;)
 

RS2004foreever

Member
SoSH Member
Dec 15, 2022
671
I got the data from a reddit link to wayback.
Fangraphs predicts the Red Sox will win 80 games. The Standard deviation last year was 5.86.
So the odds of the Red sox winning
95 .006
90 .043
89 .062
86 .153
Had the Red Sox added Montgomery, lets say he is worth 2 games:
95 .013
90 .86
89 .12
86 .247
The intuition here is Montgomery doesn't by himself really doesn't move the needle a lot.
 

Toe Nash

Member
SoSH Member
Jul 28, 2005
5,638
02130
Wouldn't Vegas O/U be a good dummy model? And agree about going over multiple years. If you're not doing better than Vegas odds over a significant sample you're probably not adding much value. I'd also like to see how close they are at predicting run differential or other underlying components of wins.
 

slamminsammya

Member
SoSH Member
Jul 31, 2006
9,425
San Francisco
Wouldn't Vegas O/U be a good dummy model? And agree about going over multiple years. If you're not doing better than Vegas odds over a significant sample you're probably not adding much value. I'd also like to see how close they are at predicting run differential or other underlying components of wins.
Yeah, this was my question as well as Id imagine wins are quite a bit noisier than run differential due to luck + sample size issues. Agree that Vegas should be a baseline as well.