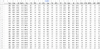
I wanted to do a little dive into the best passing seasons in the Super Bowl Era (1967-present). Just passing. Not QB rushing, not wins, etc. Just passing. First, I took the team data from pro-football-reference from each year and put them in a spreadsheet. Here's a sample of that (I can't put it all in one photo):
Then I decided to just use the passer rating as a guide here. It's not perfect, obviously, but it's at least a consistent formula. And I wanted to see the standard deviation from the great passing seasons to the seasons in which they took place. In other words, adjusting their passer rating according to the year in which it happened (the era in which they played). My hypothesis is that modern great passing seasons aren't as "great" as great passing seasons of the past due to the fact that passing is SO much more prevalent and successful nowadays than it was back then. So here's my list and how they stacked up.
Brady 2007 - 68.9% comp, 4,806 yds, 8.3 y/a, 50 td, 8 int, 117.2 rating
NFL 2007 - 61.2% comp, 3,482 yds, 6.9 y/a, 23 td, 17 int, 82.6 rating
BRADY 2007 - passer rating = 24.47 STDEV
Brady 2010 - 65.9% comp, 3,900 yds, 7.9 y/a, 36 td, 4 int, 111.0 rating
NFL 2010 - 60.8% comp, 3,544 yds, 7.0 y/a, 24 td, 16 int, 84.1 rating
BRADY 2010 - passer rating = 19.02 STDEV
Peyton 2004 - 67.6% comp, 4,557 yds, 9.2 y/a, 49 td, 10 int, 121.1 rating
NFL 2004 - 59.8% comp, 3,369 yds, 7.1 y/a, 23 td, 16 int, 82.8 rating
PEYTON 2010 - passer rating = 27.08 STDEV
Peyton 2013 - 68.3% comp, 5,477 yds, 8.3 y/a, 55 td, 10 int, 115.1 rating
NFL 2013 - 61.2% comp, 3,769 yds, 7.1 y/a, 25 td, 16 int, 86.0 rating
PEYTON 2013 - passer rating = 20.58 STDEV
Rodgers 2011 - 68.3% comp, 4,643 yds, 9.2 y/a, 45 td, 6 int, 122.5 rating
NFL 2011 - 60.1% comp, 3,675 yds, 7.2 y/a, 23 td, 16 int, 84.3 rating
RODGERS 2011 - passer rating = 27.01 STDEV
Rodgers 2020 - 70.7% comp, 4,299 yds, 8.6 y/a, 48 td, 5 int, 121.5 rating
NFL 2020 - 65.2% comp, 3,842 yds, 7.2 y/a, 27 td, 12 int, 93.6 rating
RODGERS 2020 - passer rating = 19.73 STDEV
Marino 1984 - 64.2% comp, 5,084 yds, 9.0 y/a, 48 td, 17 int, 108.9 rating
NFL 1984 - 56.4% comp, 3,294 yds, 7.1 y/a, 22 td, 21 int, 76.1 rating
MARINO 1984 - passer rating = 23.19 STDEV
Montana 1989 - 70.2% comp, 3,521 yds, 9.1 y/a, 26 td, 8 int, 112.4 rating
NFL 1989 - 55.8% comp, 3,374 yds, 7.1 y/a, 21 td, 20 int, 75.6 rating
MONTANA 1989 - passer rating = 26.02 STDEV
Warner 1999 - 65.1% comp, 4,353 yds, 8.7 y/a, 41 td, 13 int, 109.2 rating
NFL 1999 - 57.1% comp, 3,396 yds, 6.8 y/a, 22 td, 18 int, 77.1 rating
WARNER 1999 - passer rating = 22.70 STDEV
Mahomes 2018 - 66.0% comp, 5,097 yds, 8.8 y/a, 50 td, 12 int, 113.8 rating
NFL 2018 - 64.9% comp, 3,804 yds, 7.4 y/a, 27 td, 13 int, 92.9 rating
MAHOMES 2018 - passer rating = 14.78 STDEV
Favre 1995 - 63.0% comp, 4,413 yds, 7.7 y/a, 38 td, 13 int, 99.5 rating
NFL 1995 - 58.2% comp, 3,532 yds, 6.8 y/a, 22 td, 17 int, 79.2 rating
FAVRE 1995 - passer rating = 14.35 STDEV
Young 1994 - 70.3% comp, 3,969 yds, 8.6 y/a, 35 td, 10 int, 112.8 rating
NFL 1994 - 58.0% comp, 3,417 yds, 6.8 y/a, 21 td, 17 int, 78.4 rating
YOUNG 1994 - passer rating = 24.32 STDEV
So by this metric, the top 5 of this list are:
Name Year - STDEV
Peyton 2004 - 27.08
Rodgers 2011 - 27.01
Montana 1989 - 26.02
Brady 2007 - 24.47
Young 1994 - 24.32
Now, this doesn't take into account strength of schedule, games indoors v. outdoors (which are both huge factors), weather, etc. I just can't go through every game and chart all that. It's not that the data isn't there. It's just too much to sift through given my time.
The question for me is: how can I convert this standard deviation into a more easy to understand metric like RATING+? Any ideas?
PS - Surprises: That Marino's 1984 isn't higher on the list. I thought that would stand out as the single best passing season of the SB era by this metric. I just thought he SO FAR outdistanced everyone else that it would rank #1. Also, Mahomes' 2018 season obviously was off the charts, but relative to the rest of the league it wasn't nearly as great as some of these other seasons. I wonder if that's just a function of the passing getting so good it's harder to create more distance between you and the rest of the league, using passer rating as a metric. (given that there's a top end to the passer rating metric)