I was replying to someone mentioning that it was not possible in MLB. Never said they would actually do it. But in theory if you have a desperate enough team and the Sox are willing to give away their best asset for nothing then yes it can be done. In theory. I mean no one thought the Punto trade was possible or that a team like the White Sox would claim Alex Rios. Yet here we are...So some team is going to take on $15M AAV in dead money just to get Mookie (who himself is going to be getting upwards of $30M next year)? Or even a portion of it? That's insanity. There isn't a team in the league that's going to do the Red Sox the favor of sparing them some or all of Pedroia's dead money.
Sox owners want to be under cap in '20
- Thread starter nattysez
- Start date
Well, Franco isn't a factor, they almost DFAd him a few weeks ago and there's no way they are going to offer him arb this winter.They have a long-term investment in Kingery, who can play anywhere but plays a solid short, and another year of Hernandez at second. They could probably stick Kingery at third and bench Maikel Franco, but it’s not a long-term solution since top prospect Alec Bohm might be ready as soon as next summer.
Considering Segura came over in a swap of bad deals last winter, I doubt they’re super invested in him, especially after a somewhat down year.
As for Segura, the few articles I just found all have PHI expecting a bounceback season from him next year, which isn't to say they wouldn't move him in the right deal but I don't think they're actively looking to do so.
The predecessor deal to look at in regards to any possibility of moving Pedroia's money might be the Dodgers/Reds deal last winter:
"The #Reds have acquired LHP Alex Wood, OF Matt Kemp, OF Yasiel Puig, IF/C Kyle Farmer and $7M from the Dodgers in exchange for RHP Homer Bailey and minor leaguers IF Jeter Downs and RHP Josiah Gray."
Kemp was making $21.5M and got released in May by the Reds. The interesting part of this deal is that both Downs and Gray really blossomed in the minors this year for LA, both are now top 100 prospects. I think BOS could put together a somewhat similar deal involving Pedroia but it's very difficult to find the right partner.
This is very true. While none of the parties moved anyone as valuable as Betts I'd like to point something else out. Say if Betts is traded to Houston. How much do they value Forest Whitley and Kyle Tucker dollar wise. Fangraphs had an article about putting a dollar amount on prospects to the point they valued the return on the Chris Archer trade at 68 million dollars.The predecessor deal to look at in regards to any possibility of moving Pedroia's money might be the Dodgers/Reds deal last winter:
"The #Reds have acquired LHP Alex Wood, OF Matt Kemp, OF Yasiel Puig, IF/C Kyle Farmer and $7M from the Dodgers in exchange for RHP Homer Bailey and minor leaguers IF Jeter Downs and RHP Josiah Gray."
Kemp was making $21.5M and got released in May by the Reds. The interesting part of this deal is that both Downs and Gray really blossomed in the minors this year for LA, both are now top 100 prospects. I think BOS could put together a somewhat similar deal involving Pedroia but it's very difficult to find the right partner.
https://blogs.fangraphs.com/putting-a-dollar-value-on-prospects-outside-the-top-100/
A team in theory would look at a deal giving them Betts and Pedroia as taking on 45 million for 1 year and without an extension taking on 15 in year too. Is that 60 million easier to swallow than 68? Different deals of course but it all depends on how the teams value their prospects they would give up for Mookie alone as opposed to taking Mookie and Pedey on in a pure salary dump.
I think we almost have to trade one of our outfielders this winter, but I think trading more than one of them would be insanity. We don't have the organizational depth to withstand that. The obvious candidate, if they're hoping to hang onto Betts, is JBJ, who will almost certainly be the most overpaid relative to his contribution next year and who holds the least value beyond next year (i.e., they probably won't give him a qualifying offer so they won't even get a draft pick back when he goes). If you trade him, put Beni in center and Chavis in left (or possibly Betts in center and Chavis in right; he's got the arm for it), that's sustainable, and goes a long way toward getting us under the limit, though we'd still have to dump some pitching salaries, which we can ill afford to do.Try to trade Eovaldi. Or Price if you can.
Re-sign Porcello cheap.
Trade JBJ.
Trade Benintendi.
Trade Workman.
Don’t get me wrong. I don’t love any of these moves really. But if the objective is to get under the threshold and keep painful decisions have to be made.
It leaves holes. Two OF spots. Key bullpen spot. Rotation spot. Must find a way to fill them less expensively without killing the season. Not easy to do, I understand.
Although come to think of it, there's one possible strategy for moving both Beni and JBJ that I hadn't thought of, and that's to put not one but two of our current infielders in the outfield. I'm thinking of Xander, whose bat we can easily carry in LF, and whose ability to track flies has always been one of his best skills as a SS. Put him in left, Mookie in center, Chavis in right, and have an infield of Devers - Lin - Hernandez - Travis, with Chatham and Dalbec in the wings.
Probably not going to happen, but it would be an intriguing way to maximize their assets, since they have more infield than outfield talent that's cheap and ML-ready. Obviously, they'd need Xander's buy-in, but that will presumably be easier to get now that he's wrapped up for several years -- it's likely he'd be off SS by the time that deal runs out anyway.
I can't believe they'll make it down below 200, let alone 180. Just the guaranteed salaries plus the extras gets them up around 150, and they have 19 roster spots to fill at that point. If they dump the amount of talent they'd need to dump to get down to that level, they'd be unlikely to find themselves in a position to benefit from deadline help. That would qualify as "blowing it up."I don't think thats going to be the case. If this club wants to try to contend for a playoff spot they probably want a buffer in payroll so they can add at the deadline. I'm honestly thinking the payroll will be closer to 180 than 200.
Segura would be their heir apparent at second base in 2021, but they should appreciate the opportunity to move him before then, especially for starting pitching — next year’s rotation looks to be Nola/Velasquez/Eflin/?/?.Well, Franco isn't a factor, they almost DFAd him a few weeks ago and there's no way they are going to offer him arb this winter.
As for Segura, the few articles I just found all have PHI expecting a bounceback season from him next year, which isn't to say they wouldn't move him in the right deal but I don't think they're actively looking to do so.
Segura’s not worth 3/$45 on the market today and would probably give the Sox a couple Mark Loretta-type years at second, but he’s durable and the second base situation here is a unique one.
Larger point is, a healthy Price has value, likely more so to a playoff team (ironically). If the Sox want out from his contract, or do any other bad contract swaps, they’ll likely have to a) trade with a contender for b) a player who still has utility on a c) bad-but-not-terrible contract. The sum of those guys is very finite: they include Segura, Bruce, Braun, Lowrie, Cespedes, Reddick, Upton, Myers, Fowler and maybe Carpenter among position players, and Leake and Melancon among pitchers.
Last edited:
Everyone involved in the Punto deal was still able bodied and was expected to contribute on the field in some capacity. Same with Alex Rios. Pedroia is done. It would literally be volunteering to pay money for nothing, as opposed to money for potentially something. No team is desperate enough for that.I was replying to someone mentioning that it was not possible in MLB. Never said they would actually do it. But in theory if you have a desperate enough team and the Sox are willing to give away their best asset for nothing then yes it can be done. In theory. I mean no one thought the Punto trade was possible or that a team like the White Sox would claim Alex Rios. Yet here we are...
The best recent comparison is the Goldschmidt deal last winter, ARI got four young players including two instant impact ones in Kelly and Weaver. Mookie is a better player, but PG was set to make $14.5M his final year instead of around $30M like Mookie, and also Goldschmidt was open to signing an extension (which he did, quickly) and we know Mookie is not.Let’s say the Sox decide to trade Mookie for prospects. What kind of return are they looking at?
My guess is that if they're going to get a highly rated prospect, then it will be just that prospect. And even then, it probably won't be a top 20-30 kind of guy. Not for a one-year rental with a $30M salary. If they're going to get multiple prospects, it will be lottery ticket types that haven't played above A-ball.Let’s say the Sox decide to trade Mookie for prospects. What kind of return are they looking at?
Someone that immediately challenges Casas for system #1 prospect and then probably a pretty good pitching prospect that isn't expected to be an ace. Jeff Passan has said Betts would reload the prospect list.Let’s say the Sox decide to trade Mookie for prospects. What kind of return are they looking at?
Braves probably have the most intriguing options in outfielders Pache/Waters and starters Anderson/Wright. They also have 2 years of Foltynewicz left.
I’m guessing his market is LAD, ATL, SD and STL. Somebody mentioned Verdugo at some point and I think he’d make sense, but he’s a bit redundant a hitter to Benintendi and maybe a bad fit in our outfield for anywhere but left. They have two top catching prospects, so maybe the Sox like Ruiz. I don’t think they give up Dustin May.Let’s say the Sox decide to trade Mookie for prospects. What kind of return are they looking at?
Pache and Anderson from the Braves would be a good haul. Maybe the Padres do Urias and Patino. Dylan Carlson would probably be the target from St. Louis.
I think there might be a match between the Mets and Red Sox, something like:
NYM get Betts, Vazquez
BOS gets Nimmo, Ramos, Edwin Diaz, Dominic Smith, a pitching prospect
I'm sure that can be picked apart, I did it quickly, but that would fill two huge holes for the Mets and let them move past a couple of mistakes, plus Smith is blocked by Alonso.
Edit: I used the baseballtradevalues simulator, which is helpful in this kind of discussion even if it's sometimes pretty flawed.
https://www.baseballtradevalues.com/trade-simulator/
This is about right. If its straight up for Mookie you'll probably get someone like Whitley or Tucker who struggled in 2019 then a few lower tiered prospects. But you won't get a top 10 prospect. Top 25-30? Sure.I think there might be a match between the Mets and Red Sox, something like:
NYM get Betts, Vazquez
BOS gets Nimmo, Ramos, Edwin Diaz, Dominic Smith, a pitching prospect
I'm sure that can be picked apart, I did it quickly, but that would fill two huge holes for the Mets and let them move past a couple of mistakes, plus Smith is blocked by Alonso.
Edit: I used the baseballtradevalues simulator, which is helpful in this kind of discussion even if it's sometimes pretty flawed.
https://www.baseballtradevalues.com/trade-simulator/
I'd think May is a non starter but a package headlined by Ruiz and Verdugo might be enough. Ruiz doesn't solve the pitching issue however the talent is there. I'd list my Mookie suitors in no particular orderI’m guessing his market is LAD, ATL, SD and STL. Somebody mentioned Verdugo at some point and I think he’d make sense, but he’s a bit redundant a hitter to Benintendi and maybe a bad fit in our outfield for anywhere but left. They have two top catching prospects, so maybe the Sox like Ruiz. I don’t think they give up Dustin May.
Pache and Anderson from the Braves would be a good haul. Maybe the Padres do Urias and Patino. Dylan Carlson would probably be the target from St. Louis.
Anaheim
LA
STL
WAS
SD
Oakland
NYM
Cubs
White Sox
Houston
Braves
Cubs moving Schwarber and some prospects might make sense for both parties since he's by all intensive purposes a DH who would replace JD. Oakland has a reputation for making rental deals. White Sox could offer Kopech back to the Sox with others. Everyone else has been discussed already.
Last edited:
The Mets are a possible trading partner but I don’t think this one works. Nimmo’s closest active comp already plays left field for us and Ramos is probably the worst defensive catcher in baseball. Swapping Vazquez for him would give the pitching staff a massive handicap they don’t need after a bad year. Dominic Smith is fine but nothing special, and I don’t think they’d trade for another shift-susceptible LHH when Moreland and Smoak are cheaply on the market.I think there might be a match between the Mets and Red Sox, something like:
NYM get Betts, Vazquez
BOS gets Nimmo, Ramos, Edwin Diaz, Dominic Smith, a pitching prospect
I'm sure that can be picked apart, I did it quickly, but that would fill two huge holes for the Mets and let them move past a couple of mistakes, plus Smith is blocked by Alonso.
Smith is pre-arb, exactly what your ownership is looking for, and Ramos could maybe take some of the DH time if JDM is a goner. Dunno, just a quickly formulated idea, like I said.The Mets are a possible trading partner but I don’t think this one works. Nimmo’s closest active comp already plays left field for us and Ramos is probably the worst defensive catcher in baseball. Swapping Vazquez for him would give the pitching staff a massive handicap they don’t need after a bad year. Dominic Smith is fine but nothing special, and I don’t think they’d trade for another shift-susceptible LHH when Moreland and Smoak are cheaply on the market.
No, totally. I think there are combinations that work there. I just think no one in baseball is looking for a first baseman and one of Zimmerman, Moreland, Smoak or Abreu will fall cheaply to the Sox bridge to Casas, or else Dalbec will get a shot.Smith is pre-arb, exactly what your ownership is looking for, and Ramos could maybe take some of the DH time if JDM is a goner. Dunno, just a quickly formulated idea, like I said.
OK, but again this gets to what I think is one of the fundamental issues in baseball right now. You can sign one of those guys, but if they suck and are healthy, your only choices are keeping them on the roster or releasing them, whereas if you have a guy like Smith and they suck, you can option them to AAA, keep their rights, hope they turn it around and try someone else in the meantime. Guys like the veterans you mention might not cost too much, but they limit a team's flexibility.I just think no one in baseball is looking for a first baseman and one of Zimmerman, Moreland, Smoak or Abreu will fall cheaply to the Sox bridge to Casas, or else Dalbec will get a shot.
If it's a matter of trading a piece off the big league roster (to shed salary) and getting a cheap, pre-arb guy like Smith as part of the return, that seems like a no-brainer to me. I don't think Dom Smith is a guy you trade a prospect for, but he's not a bad return in a salary dump since he potentially fills a need. I don't see how anyone can object to that except on the basis of not wanting to trade away whoever it is that they trade, be it Betts or Benintendi or whomever.OK, but again this gets to what I think is one of the fundamental issues in baseball right now. You can sign one of those guys, but if they suck and are healthy, your only choices are keeping them on the roster or releasing them, whereas if you have a guy like Smith and they suck, you can option them to AAA, keep their rights, hope they turn it around and try someone else in the meantime. Guys like the veterans you mention might not cost too much, but they limit a team's flexibility.
Good point. I suppose I’m just not wild about Smith. Advanced scouting and shifting have really sapped a lot of value from LHH with average power.OK, but again this gets to what I think is one of the fundamental issues in baseball right now. You can sign one of those guys, but if they suck and are healthy, your only choices are keeping them on the roster or releasing them, whereas if you have a guy like Smith and they suck, you can option them to AAA, keep their rights, hope they turn it around and try someone else in the meantime. Guys like the veterans you mention might not cost too much, but they limit a team's flexibility.
I apologize in advance for the game-thready nature of this, but I feel things are going to get way worse before they get better, all in the effort to get under 208. 2020 might not be a fun year, depending on who is here.
It's not like they're going to have a payroll of $50 million. They'll still have plenty of talent, including the best left side of the infield in baseball. There will be plenty of fun stuff to watch, even if they don't win a championship next season.I apologize in advance for the game-thready nature of this, but I feel things are going to get way worse before they get better, all in the effort to get under 208. 2020 might not be a fun year, depending on who is here.
Didn’t the braves trade vizcaino when he was hurt this year?Everyone involved in the Punto deal was still able bodied and was expected to contribute on the field in some capacity. Same with Alex Rios. Pedroia is done. It would literally be volunteering to pay money for nothing, as opposed to money for potentially something. No team is desperate enough for that.
You can obviously entice a team to take $30 million of dead money, what you have to do is give them more than $30 million in excess value otherwise. I’m sure you could trade Cannon, Mata, Dalbec, and Pedroia to Arizona for $1 million in international bonus money or something. That would be overpaying to get rid of the contract, I think, but that’s how you do it.Didn’t the braves trade vizcaino when he was hurt this year?
Yeah. Someone said they couldn’t and it’s not the nhl.You can obviously entice a team to take $30 million of dead money, what you have to do is give them more than $30 million in excess value otherwise. I’m sure you could trade Cannon, Mata, Dalbec, and Pedroia to Arizona for $1 million in international bonus money or something. That would be overpaying to get rid of the contract, I think, but that’s how you do it.
It’s certisnly possible. But still unlikely in this scenario.
This one might come down to insurance for it to be remotely feasible.
If Betts needs to be traded, and the goal is to shed salary, do you think there is a team who would take him, plus one of our big dollar pitchers? Not sure the return would be great, but it would reset the balance sheet quickly.
It doesn't seem like there are many teams that would take on that much salary/risk.
It doesn't seem like there are many teams that would take on that much salary/risk.
My contribution here is that I sincerely hope they can maneuver to keep Betts because he is the most fun and likable player of my lifetime. And as a kid who came of age with the Boggs & Clemens teams, that means a lot to me.
Now, I don’t live in New England anymore, so I don’t have the same day-in, day-out relationship with the team that many of you do. Yesterday on the phone my mother was lamenting how poor the Sox were this season, rehashing all the disappointments. But then I mentioned Mookie’s insane throw from a few days ago, and we both started talking about how great it is to watch him.
I’m also insulated from the local sports media, which I like to think gives some better perspective. Being back in Mass for 2 weeks in August was enough to turn my stomach with the disingenuous arguments and clickbait nonsense. But I find a pure joy in watching Mookie go about his business, a pleasure heightened but the sense that something amazing could happen at any moment.
I understand the folks who prioritize winning above the sentimental crap like I’m throwing out. But my grandmother’s favorite player was Harry Agganis, and my mother’s was Dewey. Part of loving the team is loving that one player who makes the game something more for you.
Edit: Actually, when I brought up Mookie’s throw, my mother’s first response was, “Dewey used to do that all time time.”
Last edited:
This is a great post. The thing about Betts is this - despite some game thread protestations to the contrary (and I know they are just a series of hot takes but some of the posts this season made it sound like Betts was awful), the guy has been fantastic this season and his only real sin is that he was even better last year.My contribution here is that I sincerely hope they can maneuver to keep Betts because he is the most fun and likable player of my lifetime. And as a kid who came off age with the Boggs & Clemens teams, that means a lot to me.
Now, I don’t live in New England anymore, so I don’t have the same day-in, day-out relationship with the team that many of you do. Yesterday on the phone my mother was lamenting how poor the Sox were this season, rehashing all the disappointments. But then I mentioned Mookie’s insane throw from a few days ago, and we both started talking about how great it is to watch him.
I’m also insulated from the local sports media, which I like to think gives some better perspective. Being back in Mass for 2 weeks in August was enough to turn my stomach with the disingenuous arguments and clickbait nonsense. But I find a pure joy in watching Mookie go about his business, a pleasure heightened but the sense that something amazing could happen at any moment.
I understand the folks who prioritize winning above the sentimental crap like I’m throwing out. But my grandmother’s favorite player was Harry Agganis, and mo mother’s was Dewey. Part of loving the team is loving that one player who makes the game something more for you.
To your point, the guy is a joy to watch not just because of the plays he makes but how he plays the game. That alone wouldn't be worth mortgaging the team's future and we've seen countless examples of how sentimental executives signed the old hometown favorite because its what fans want, only to see production drop off while the contract hamstrings the team. However Betts isn't just popular - the guy has been in the top 15 in WAR every season since 2016 and that includes a few defensive seasons as well as offensive ones. And he isn't even 27 years old yet.
As we all know, long-term, large AAV/total dollar contracts are very risky, especially for players who have likely played through at least part of their peak. Betts may well have more upside and when you add his production to his well-earned face of the franchise status as well as his relatively young age, its clear that he is a risk the Sox should take.
This makes so little sense to do now, rather than in 2021. Trying to get under the cap basically throws away a year of possible contention.
Once you sign off on paying big money to Bogaerts, Eovaldi and Sale, then you are committing to trying to win in 2019 and 2020. Now they're trying to back out of it.
Waiting till 2021 makes it so much easier to get under the threshold-- Betts may leave as a free agent, JD could already be gone or could opt out if the team tells him they're going to rebuild, Bradley will probably be gone, moving one of the expensive starting pitchers should be possible (and isn't possible now) and you'll have another year to try to develop some young players. Doing it now seems shortsighted and really damaging.
Henry deserves a lot of credit for spending more than all the other owners for the past 2 years. But I don't get this decision at all, when it would make a lot of sense to do it after next season.
Maybe they know more about Sale's injury then they are letting on? If it comes out that he needs serious surgery then it would make total sense to punt next year. i dont see how this team can be a serious contender for the WS without a dominant chris sale. Price is what he has been the last few years, not a cy young candidate but a decent 2/3 starter.
Isn't that exactly what happened a full year ago?Maybe they know more about Sale's injury then they are letting on? If it comes out that he needs serious surgery then it would make total sense to punt next year. i dont see how this team can be a serious contender for the WS without a dominant chris sale. Price is what he has been the last few years, not a cy young candidate but a decent 2/3 starter.
eh i would say that 2018 was a pretty dominant year for chris sale. Sure, he only threw 158 innings but he had a FIP of 1.98 and an ERA of 2.11. So sure, if we get a year like that out of him, i like our chances a lot more than if we get another year like this one.
Agreed. And if they knew they wanted to cut payroll this winter then they should have thrown all their chips in to 2019.This makes so little sense to do now, rather than in 2021. Trying to get under the cap basically throws away a year of possible contention.
Once you sign off on paying big money to Bogaerts, Eovaldi and Sale, then you are committing to trying to win in 2019 and 2020. Now they're trying to back out of it.
Waiting till 2021 makes it so much easier to get under the threshold-- Betts may leave as a free agent, JD could already be gone or could opt out if the team tells him they're going to rebuild, Bradley will probably be gone, moving one of the expensive starting pitchers should be possible (and isn't possible now) and you'll have another year to try to develop some young players. Doing it now seems shortsighted and really damaging.
Henry deserves a lot of credit for spending more than all the other owners for the past 2 years. But I don't get this decision at all, when it would make a lot of sense to do it after next season.
This gets thrown around a lot without any merit, but in this case with the direct about face on spending, it makes you wonder if they are looking to sell the team.
Yes. Thank you. Why exactly is the front office not keeping this exceptional core together for another season? Has Dombrowski admitted to holding a gun to Henry's head when he mentioned potential contracts for Eovaldi and Sale last winter? Does anyone really think ownership has been properly held to task for their complicity in these bad deals? Why would any fan care about the impaired profits of a minority owner whose stake in the team is pure vanity? The farm system won't be magically restocked because Betts and JBJ are traded prior to 2021, and it's near folly to think that any team will be taking Pedroia's deliberately uninsured contract off our hands. Besides the uncertainty surrounding the details of a new CBA in 2021 (that would be a cool thread), is avoiding a 10 spot drop in a future draft worth moving Betts, JDM, or losing Holt this winter? There's no way of telling how our aging and overpriced starting rotation will bounce back next year, but they did prove it on the biggest stage less than 12 months ago. Regardless, I'm not willing to accept the bullshit Henry and Lerner spoon-fed to every journalist last week. Let it ride and keep them together for another season.This makes so little sense to do now, rather than in 2021. Trying to get under the cap basically throws away a year of possible contention.
Once you sign off on paying big money to Bogaerts, Eovaldi and Sale, then you are committing to trying to win in 2019 and 2020. Now they're trying to back out of it.
Waiting till 2021 makes it so much easier to get under the threshold-- Betts may leave as a free agent, JD could already be gone or could opt out if the team tells him they're going to rebuild, Bradley will probably be gone, moving one of the expensive starting pitchers should be possible (and isn't possible now) and you'll have another year to try to develop some young players. Doing it now seems shortsighted and really damaging.
Henry deserves a lot of credit for spending more than all the other owners for the past 2 years. But I don't get this decision at all, when it would make a lot of sense to do it after next season.
The exciting part is we have a core of Devers and Boegarts who’s extension was a steal. The worrisome part is the amount of years and money tied up in a starting pitching staff with fragile arms. I’d love to see a rotation rebuild with some assets acquired in a trade but that won’t happen anytime soon.
[B]Pete Abraham[/B]Verified account @[B]PeteAbe[/B] 13m13 minutes ago
Kennedy says there is no mandate to get under the CBT threshold of $208 million. But it is a goal. It’s possible they could stay over the limit.
Kennedy says there is no mandate to get under the CBT threshold of $208 million. But it is a goal. It’s possible they could stay over the limit.
I'm not sure how much of this has already been discussed, but I wanted to dig into the Sox financials to tease out where this strategy fits in the team's overall business operation.
First and foremost, let's take a look at the P&L:
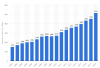
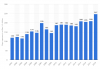
What's remarkable to me is how poorly the team was doing when Henry & Co bought the Sox in 2002, with the organization losing money in several years, and how much they have built the Red Sox into a revenue-generating machine that netted over a half-billion dollars in 2018, more than 3x the reveneu the team generated in 2002 with YoY growth that would make a lot of tech companies jealous.
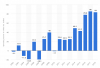
While I can't find a detailed breakdown of all operating expenses, we can infer the total from the operating income and compare that against player expenses:
What's striking to me is how the % of operating income attributed to players salaries has become a much smaller share of overall operating expenses, from 71.6% in 2002 to only 57.2% in 2018. Likewise, the percentage of player expenses relative to revenue has shrunk from 72.5% to 47.9%.
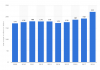
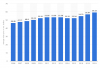
Next, I wanted to look at the revenue breakdown, which, again, was hard to tease out, but I was able to determine how much comes from ticket sales:
Despite having fixed capacity at Fenway, the Sox have been able to squeeze out more and more ticket revenue, largely due to increased ticket prices, though I'm curious how much of this is also attributable to postseason play (probably not a ton). What's perhaps more interesting, though, is that the share of revenue attributed to ticket sales has also dropped, from 64.3% to 42.8%, which implies that a big chunk of the new revenue is coming from TV contracts and other sources.
So what's the takeaway from all this? Well, the Sox have really healthy revenues and a solid profit margin, but one that isn't completely immune to the costs of the luxury tax - a $20M surcharge takes a big bite out of the Sox' yearly profit. Furthermore, if the Sox want to reduce the costs of goods sold and improve their profit margin, shaving player payroll is obviously the easiest way to do it. If the team manages to slash payroll to $208M in 2020, the Sox would save nearly $60M ($40M in salary, ~$20M in tax penalty - someone correct me if I"m wrong here), which would greatly increase their profit margin. I think a lot of people would consider this good business.
The ultimate question, however, is will this enable the Sox to put a quality product on the field the next 2-4 years and, if not, how will that impact their revenue? You have to think their TV contracts are safe, which largely mitigates against the risk of a poorly performing team, at least year-over-year. However, ticket sales are still a big % of the team's revenue and a return to the 2010-2015 ticket sales might offset a lot of the savings you get by trimming down the roster. The biggest threat, IMO, is that Red Sox nation interprets major and abrupt cost-saving moves as a firesale, especially if they trade Mookie, and they will make their displeasure clear by not buying tickets or watching games, at least for a season or two.
BTW, Forbes has some good stuff related to the Sox and I've included some graphs from Statista below that I used for my source data:
P.S. If anyone knows how to insert prettier-looking tables, please let me know.
First and foremost, let's take a look at the P&L:
| Year___ | Net Revenue | Operating Income | Profit Margin | YoY Growth |
| 2002 | 171 | -2.1 | -1.23% | |
| 2003 | 190 | 11.4 | 6.00% | 11.11% |
| 2004 | 201 | -11.3 | -5.62% | 5.79% |
| 2005 | 206 | -18.5 | -8.98% | 2.49% |
| 2006 | 234 | 19.5 | 8.33% | 13.59% |
| 2007 | 263 | -19.1 | -7.26% | 12.39% |
| 2008 | 269 | 25.7 | 9.55% | 2.28% |
| 2009 | 266 | 40 | 15.04% | -1.12% |
| 2010 | 272 | -1.1 | -0.40% | 2.26% |
| 2011 | 310 | 25.4 | 8.19% | 13.97% |
| 2012 | 336 | 23.9 | 7.11% | 8.39% |
| 2013 | 357 | 25.3 | 7.09% | 6.25% |
| 2014 | 370 | 49.2 | 13.30% | 3.64% |
| 2015 | 398 | 43.2 | 10.85% | 7.57% |
| 2016 | 434 | 78.6 | 18.11% | 9.05% |
| 2017 | 453 | 86 | 18.98% | 4.38% |
| 2018 | 516 | 84 | 16.28% | 13.91% |
What's remarkable to me is how poorly the team was doing when Henry & Co bought the Sox in 2002, with the organization losing money in several years, and how much they have built the Red Sox into a revenue-generating machine that netted over a half-billion dollars in 2018, more than 3x the reveneu the team generated in 2002 with YoY growth that would make a lot of tech companies jealous.
While I can't find a detailed breakdown of all operating expenses, we can infer the total from the operating income and compare that against player expenses:
| Year___ | OpEx___ | Player Expenses | Player % (Opex) | Player % (Rev) |
| 2002 | 173.1 | 124 | 71.6% | 72.5% |
| 2003 | 178.6 | 116 | 64.9% | 61.1% |
| 2004 | 212.3 | 139 | 65.5% | 69.2% |
| 2005 | 224.5 | 154 | 68.6% | 74.8% |
| 2006 | 214.5 | 146 | 68.1% | 62.4% |
| 2007 | 282.1 | 199 | 70.5% | 75.7% |
| 2008 | 243.3 | 165 | 67.8% | 61.3% |
| 2009 | 226 | 145 | 64.2% | 54.5% |
| 2010 | 273.1 | 187 | 68.5% | 68.8% |
| 2011 | 284.6 | 191 | 67.1% | 61.6% |
| 2012 | 312.1 | 190 | 60.9% | 56.5% |
| 2013 | 331.7 | 186 | 56.1% | 52.1% |
| 2014 | 320.8 | 182 | 56.7% | 49.2% |
| 2015 | 354.8 | 208 | 58.6% | 52.3% |
| 2016 | 355.4 | 205 | 57.7% | 47.2% |
| 2017 | 367 | 209 | 56.9% | 46.1% |
| 2018 | 432 | 247 | 57.2% | 47.9% |
What's striking to me is how the % of operating income attributed to players salaries has become a much smaller share of overall operating expenses, from 71.6% in 2002 to only 57.2% in 2018. Likewise, the percentage of player expenses relative to revenue has shrunk from 72.5% to 47.9%.
Next, I wanted to look at the revenue breakdown, which, again, was hard to tease out, but I was able to determine how much comes from ticket sales:
| Year___ | Average Ticket Price | Ticket Sales | Tix Revenue % | Tix Price YoY |
| 2002 | ||||
| 2003 | ||||
| 2004 | ||||
| 2005 | ||||
| 2006 | 46.46 | |||
| 2007 | 47.71 | 2.69% | ||
| 2008 | 48.8 | 2.28% | ||
| 2009 | 50.24 | 171 | 64.3% | 2.95% |
| 2010 | 52.32 | 176 | 64.7% | 4.14% |
| 2011 | 53.38 | 180 | 58.1% | 2.03% |
| 2012 | 53.38 | 179 | 53.3% | 0.00% |
| 2013 | 53.38 | 179 | 50.1% | 0.00% |
| 2014 | 52.32 | 172 | 46.5% | -1.99% |
| 2015 | 52.34 | 176 | 44.2% | 0.04% |
| 2016 | 54.79 | 187 | 43.1% | 4.68% |
| 2017 | 56.97 | 192 | 42.4% | 3.98% |
| 2018 | 59.32 | 221 | 42.8% | 4.12% |
Despite having fixed capacity at Fenway, the Sox have been able to squeeze out more and more ticket revenue, largely due to increased ticket prices, though I'm curious how much of this is also attributable to postseason play (probably not a ton). What's perhaps more interesting, though, is that the share of revenue attributed to ticket sales has also dropped, from 64.3% to 42.8%, which implies that a big chunk of the new revenue is coming from TV contracts and other sources.
So what's the takeaway from all this? Well, the Sox have really healthy revenues and a solid profit margin, but one that isn't completely immune to the costs of the luxury tax - a $20M surcharge takes a big bite out of the Sox' yearly profit. Furthermore, if the Sox want to reduce the costs of goods sold and improve their profit margin, shaving player payroll is obviously the easiest way to do it. If the team manages to slash payroll to $208M in 2020, the Sox would save nearly $60M ($40M in salary, ~$20M in tax penalty - someone correct me if I"m wrong here), which would greatly increase their profit margin. I think a lot of people would consider this good business.
The ultimate question, however, is will this enable the Sox to put a quality product on the field the next 2-4 years and, if not, how will that impact their revenue? You have to think their TV contracts are safe, which largely mitigates against the risk of a poorly performing team, at least year-over-year. However, ticket sales are still a big % of the team's revenue and a return to the 2010-2015 ticket sales might offset a lot of the savings you get by trimming down the roster. The biggest threat, IMO, is that Red Sox nation interprets major and abrupt cost-saving moves as a firesale, especially if they trade Mookie, and they will make their displeasure clear by not buying tickets or watching games, at least for a season or two.
BTW, Forbes has some good stuff related to the Sox and I've included some graphs from Statista below that I used for my source data:
P.S. If anyone knows how to insert prettier-looking tables, please let me know.
But hasn't that line of thinking been around since the middle of the decade? Perhaps they are. Wouldn't blame them seeing what sports teams are going for these days.Agreed. And if they knew they wanted to cut payroll this winter then they should have thrown all their chips in to 2019.
This gets thrown around a lot without any merit, but in this case with the direct about face on spending, it makes you wonder if they are looking to sell the team.
I'd love to know how they think they'll field a competitive team if JD opts in and Mookie signs and they try to stay under $208m, other than taking the "throw a bunch of crappy guys at various positions and hope a few pan out" approach that resulted in the execrable 2019 bullpen. Maybe that's what he means by "difficult." Hopefully the reaction to Henry's comments has them rethinking the "get under $208" approach.
Maybe John Henry's to be taken "seriously not literally." A lot of that's been going around.
View: https://twitter.com/jcmccaffrey/status/1178707000299003905
View: https://twitter.com/SPChrisHatfield/status/1178711008443023360
Maybe John Henry's to be taken "seriously not literally." A lot of that's been going around.
View: https://twitter.com/jcmccaffrey/status/1178707000299003905
View: https://twitter.com/SPChrisHatfield/status/1178711008443023360
Is David Price a better risk at that price and term than Dallas Kuechel? Relative to what Cole Hamels will get (I assume something closer to 2/$30)?Is trading Price and along with $30 mil an option? Would any team be interested in David Price for 3/$60?
As someone here said, it was a message to Boras that if JD opts outs out, the Red Sox won’t be among the bidders. That makes sense. As I’ve argued, there’s a lot of DH’s for a lot cheaper. And that’s 2/3rds of what you need to sign Betts long term.I'd love to know how they think they'll field a competitive team if JD opts in and Mookie signs and they try to stay under $208m, other than taking the "throw a bunch of crappy guys at various positions and hope a few pan out" approach that resulted in the execrable 2019 bullpen. Maybe that's what he means by "difficult." Hopefully the reaction to Henry's comments has them rethinking the "get under $208" approach.
Maybe John Henry's to be taken "seriously not literally." A lot of that's been going around.
View: https://twitter.com/jcmccaffrey/status/1178707000299003905
View: https://twitter.com/SPChrisHatfield/status/1178711008443023360
I also think it may be a message to folks like Porcello and Bradley, that we aren’t going to be paying them 8-figures next year.
My interpretation of the implications of the various statements by ownership and leadership:
1. Mookie will be back in 2020. They'll try to sign him to an extension, but if not they will keep him and then try to sign him as a FA. Trading Mookie would almost automatically make 2020 a "bridge year."
2. I think they hope that JD opts out, and they will let him walk and use the savings to reduce payroll and luxury tax liability. They will not offer him an extension or renegotiation of his current deal.
3. JBJ gets traded. Will definitely happen if JD opts in, but will probably happen even if he opts out.
4. If JD opts out and JBJ gets traded, it's possible that they could re-sign BH, who could end up seeing a lot of time in LF (perhaps in a platoon with Travis or Chavis).
5. If JD opts in, they will explore trading away one of the high-priced SP - I think this is what Sam Kennedy was referring to as being "difficult." As it is, they have to rely on these guys being healthy and productive if they hope to be competitive in 2020, and dealing any of them makes competing that much more challenging. And they may not get much return.
I've seen Holt's name thrown around a bit and am wondering what people think of his market. He's defensively versatile but not really good on the left side of the infield. Good contact skills and batting eye but no power or speed to speak of. He turns 32 next season.
Maybe this is grossly underselling his market, but given his vocal and repeated statements about wanting to stay with the Red Sox, would 2 years/$5M total be enough? Will there be many teams who want him to start? If not, how many will offer him a multi-year deal? And at what price per year?
I don't think he's in the same tier as Lowrie, Gonzalez and LeMahieu were. Seems closer to Josh Harrison (1/$2M), Asdrubal Cabrera (1/$3.5M) and maybe Freddy Galvis (1/$5.5M).
And if we could retain him on a cheap/below-market deal, I'd do it. Good in the clubhouse, and the team needs depth.
Yeah, Mookie is doing us a favor by making it clear he's a one-year rental, which should drastically reduce the chances of the Sox trading him.Whether they stay under or go slightly over might depend entirely on what Martinez does. If he opts out, it gets a bit easier to squeeze under the cap while maintaining a semi-plausible attempt at fielding a strong team (i.e. not selling players off, perhaps signing a free agent or two). If he stays, the only way they're likely to get under or barely under would be trading Mookie (because who else is moveable and saves them money?). And I'm still of the mind that if they trade Mookie, no one is going to be pleased with the return. Not that he's not desirable to a bunch of teams, but on a 1/25 or 1/30 type deal, he's not bringing back a pack of hot prospects and certainly no one that will help in 2020.
He's a consistently decent hitter (2017 aside) who can play anywhere except C and maybe CF, and is a positive clubhouse presence. He's not a difference-maker, but he's high-quality depth. I wouldn't be surprised if he finds somebody to give him a 2-year contract in the $8-10M range (total, not AAV). I doubt it will be the Red Sox, though, since they're trying to get under the cap and have Hernandez and Lin on hand (the latter of whom is out of options).I've seen Holt's name thrown around a bit and am wondering what people think of his market. He's defensively versatile but not really good on the left side of the infield. Good contact skills and batting eye but no power or speed to speak of. He turns 32 next season.
3 years 3.5 aav from someone like the rangersI've seen Holt's name thrown around a bit and am wondering what people think of his market.
3 years? Wow, by my count, there were just 12 guys who got 3 or more years last year. Markets can change, but I can’t see Holt getting that kind of commitment. Every team has a cheap Marco or Lin type running out of options.3 years 3.5 aav from someone like the rangers
Even with Pedroia's injuries, Holt has only been a part-time player, mostly against right-handed pitchers. Over the past four seasons, he has had 1150 PA, of which ~81.2% have been against left-handers. In 2017-18, he hit for a higher average against LHP than RHP but in 2106 and 2019 he hit poorly against LHP. He will also turn 32 a little less than halfway through the season and is eligible to become a free agent after being paid $3,575,000 this year.
I'd guess that they'd let him go and hope that he doesn't get a good offer as a free agent, which would give them a chance of re-signing him at a lower cost.
I'd guess that they'd let him go and hope that he doesn't get a good offer as a free agent, which would give them a chance of re-signing him at a lower cost.