Farrell making the hit and run call last night with JBJ, kept them out of the inning ending double play, and they ended up scoring eleventy billion runs (which probably would have scored anyhow in subsequent innings). This has the feel so far of pushing all the right buttons like in 2013.
What's gone right?
- Thread starter nvalvo
- Start date
Whoa. If that's the real JBJ, then the guy we're hoping that Mookie becomes is playing next to him in CF.Saw this on twitter: JBJ's last 81 games: 24 doubles, 8 triples, 13 HR with a slash of .298/.361/.588
That's a nice stat line. And by nice, I mean 90 XBH, legit All Star nice.
Hell, those would be respectable XBH numbers for a full season, for a good defensive center fielder.Whoa. If that's the real JBJ, then the guy we're hoping that Mookie becomes is playing next to him in CF.
That's a nice stat line. And by nice, I mean 90 XBH, legit All Star nice.
Jackie's currently on a pace for 20 home runs and 20 triples this year. That's only been done 8 times in baseball history. Oddly, two of them were in the same season (2007, Jimmy Rollins & Curtis Granderson).
Eh, he used to be good. Did you see him drop that pop fly last night? That play alone just cost him the Gold Glove! (I'm only half-kidding, given blooper highlights and voters' tendencies.)Hell, those would be respectable XBH numbers for a full season, for a good defensive center fielder.
...
Good thing he's hitting grand slams to make up for it...
Nice? Yikes. It's fantastic! .949 ops from the CF position? Holy cow.Whoa. If that's the real JBJ, then the guy we're hoping that Mookie becomes is playing next to him in CF.
That's a nice stat line. And by nice, I mean 90 XBH, legit All Star nice.
By the way, I just *love* comparing him to Ellsbury at this point. It's very, very fun.
Paging @Plympton91Nice? Yikes. It's fantastic! .949 ops from the CF position? Holy cow.
By the way, I just *love* comparing him to Ellsbury at this point. It's very, very fun.
Didn't look like anything wrong with his arm on that throw to the plate in the 2nd inning - reached Hanigan on a line from medium leftcenter.Since this is the "what's gone right" thread, it's fair to point out that JBJ could be moved to LF rather than go down for arm surgery, if he indeed has injured it.
When the announcers credited what a great job Sean-O was doing I wanted to puke. He pitched pretty exactly to his (horrible) career expectations.We just won a game started by despite someone named Sean O'Sullivan.
Get well quick, Eduardo!
94
131
132
119
158
198 (!)
148
113
Those are the wRC+ of the top 8 players on the team ranked by PA.
131
132
119
158
198 (!)
148
113
Those are the wRC+ of the top 8 players on the team ranked by PA.
Here's where the Sox currently rank among AL teams in the following categories:
AVG: 1st
OBP: 1st
SLG: 1st
OPS: 1st
Runs: 1st
Doubles: 1st
Triples: 1st
Stolen Bases: 2nd
Stolen Base%: 1st (92.59%)
On the pitching side:
Strikeouts: 1st
AVG Against: 5th lowest
SLG Against: 6th lowest
HR Allowed: 3rd least
But we've also allowed the most walks in the league. Those have been a killer.
Sox have the highest K/9 in the AL, but the 11th highest K/BB.
Edit to add: The Cubs lead the majors in nearly every category it seems like. Currently at 25-6, a 130 win pace. Scary good team. Team OBP is a sick .368...
The 2003 team OPS was .851. That team might be the better comp to this year's model, at least so far...only with a deeper bullpen from the jump.Sox team OPS is .820.
The 2004 team was .811.
Think about that.
Fewest errors.Here's where the Sox currently rank among AL teams in the following categories:
On the pitching side:
Strikeouts: 1st
AVG Against: 5th lowest
SLG Against: 6th lowest
HR Allowed: 3rd least
But we've also allowed the most walks in the league. Those have been a killer.
Sox have the highest K/9 in the AL, but the 11th highest K/BB.
.
He's their #7 starter, and did not issue a walk over 6 innings. He was still miles better than Henry Owens, the guy he replaced in the rotation.When the announcers credited what a great job Sean-O was doing I wanted to puke. He pitched pretty exactly to his (horrible) career expectations.
Get well quick, Eduardo!
Incredible offense and team speed, great defensively, very strong bullpen. Just have to stabilize the starting pitching. 20-13 with next to nothing from Price and Clay and no Rodriguez yet.
True, my point was considering where league-wide offense is today it is remarkableThe 2003 team OPS was .851. That team might be the better comp to this year's model, at least so far...only with a deeper bullpen from the jump.
The Sox actually have them in wRC+, slugging, offense WAR and are tied in wOBA and home runs. Of course if you take out Ortiz and sub him for a pitcher it's a different story.*Here's where the Sox currently rank among AL teams in the following categories:
Edit to add: The Cubs lead the majors in nearly every category it seems like. Currently at 25-6, a 130 win pace. Scary good team. Team OBP is a sick .368...
The Sox wRC+ is edging out the 2003 team 124 to 120. Just a dominant offense relative to the league. The 2003 team had Damon and Walker who were the only slightly below league average in OPS+ (94 and 95 respectively) so they didn't have the one gaping hole that this team has at the catcher position.
*Just for fun, Arrieta, Hammel and Lackey are out OPS'ing Hanigan and Vazquez .569 to .546. Also outslugging them .304 to .273.
Last edited:
Poor Atlanta.
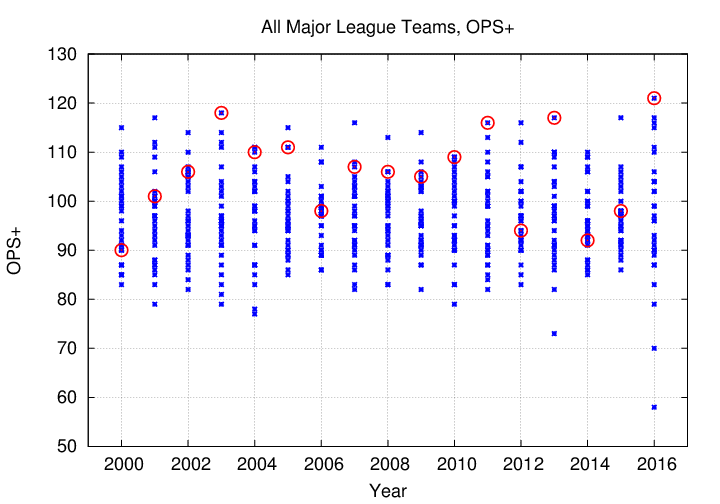
Note that even though Chicago has scored more runs per game than Boston in 2016, the adjustment for the overall
lower scoring environment in the National League causes them to have a _lower_ OPS+ (note how Boston
is on top in 2016 in the first graph).
I think you meant to say the overall higher scoring environment in the National League.Note that even though Chicago has scored more runs per game than Boston in 2016, the adjustment for the overall
lower scoring environment in the National League causes them to have a _lower_ OPS+ (note how Boston
is on top in 2016 in the first graph).
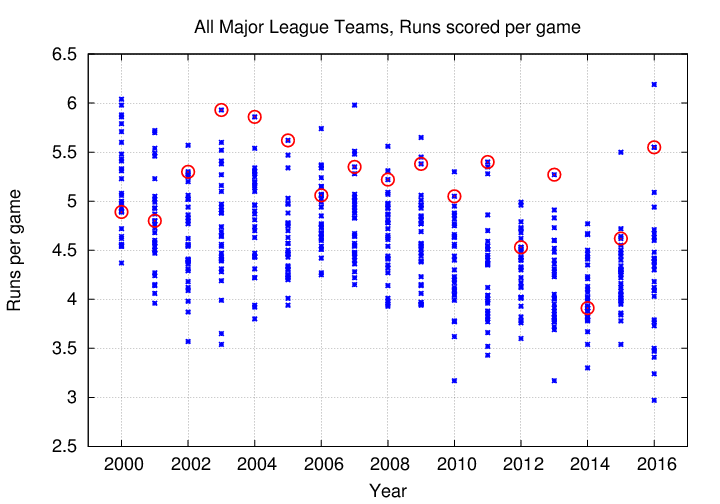
The Cubs' higher run scoring has two dimensions. It's mostly the league difference, but also a bit of greater efficiency. The Cubs and Red Sox are essentially identical in terms of their ratio of runs created per game to league average runs per game--Cubs at 1.460 and Sox at 1.456. But the NL is scoring a third of a run per game more than the AL, so even if the two teams were converting RC to actual runs with equal efficiency, the Cubs would be scoring more. But the Cubs' ratio of actual runs to RC is also a bit higher: 0.95 vs. 0.93. The two factors together add up to a significant difference in runs scored per game (6.19 to 5.55).
I'm not sure how to find an answer easily, so I'll ask. Is the NL being a higher run scoring environment a likely SSS abnormality, or has this been a trend in recent years? It doesn't make intuitive sense.I think you meant to say the overall higher scoring environment in the National League.
The Cubs' higher run scoring has two dimensions. It's mostly the league difference, but also a bit of greater efficiency. The Cubs and Red Sox are essentially identical in terms of their ratio of runs created per game to league average runs per game--Cubs at 1.460 and Sox at 1.456. But the NL is scoring a third of a run per game more than the AL, so even if the two teams were converting RC to actual runs with equal efficiency, the Cubs would be scoring more. But the Cubs' ratio of actual runs to RC is also a bit higher: 0.95 vs. 0.93. The two factors together add up to a significant difference in runs scored per game (6.19 to 5.55).
This year, there are a number of rebuilding clubs in the NL (CIN, PHI, ATL, MIL, SDP), and none in the AL. Perhaps this is because of NL juggernauts like CHI, NYM, LAD, SFG and WAS led teams to punt, while a high degree of AL parity across the divisions made everyone feel they had a chance.I'm not sure how to find an answer easily, so I'll ask. Is the NL being a higher run scoring environment a likely SSS abnormality, or has this been a trend in recent years? It doesn't make intuitive sense.
There are a handful of baaaaaaad pitching staffs in the NL. The Reds and Brewers both have staff ERAs above 5. (This is partly because of, and partly explains, the Cubs; Chicago has scored 60 runs in 7 games against Cincinnati.) We've just been kicking the %$#@ out of a very sorry looking Oakland pitching staff, but there are four (!) worse staffs by FIP in the NL.
Thank you, kind sir, for catching my mistake. You're exactly right -- I had it backwards. I guess my brain was thinking of all those other years, when the NL scored on average fewer runs per game.I think you meant to say the overall higher scoring environment in the National League.
Of course, those were _full years_, not just months, so 2016 may turn out in the end to follow the usual pattern. Let's see where things are in September.
What's gone weird?
1) The Sox have four players in the top 30 (out of 192) for position player fWAR.
2) Mookie Betts is not one of them.
3) Travis Shaw is one of them.
4) Jackie Bradley Jr. is having a typical Hanley Ramirez peak year: wRC+ of 165 and UZR150 of -14.6.
5) David Ortiz is posting the best batting line of his career...at 40.
6) David Price's ERA is more than double his FIP. The difference between them is more than double that of any other AL pitcher.
7) Steven Wright has the third-best ERA in the American League.
This is how you have a great season. Hold your own vs. the good teams, bury the bad teams. Sox are doing that so far. But dammit if Baltimore isn't, too.They are beating up on the bad teams on the schedule - 12-4 so far vs. the A's, Astros, Braves and Yankees.
As of today, the Sox have outscored their opponents 38-11 in the 1st inning of all games. Considering that we've watched Boston needing to play from behind for (approximately) 5,276,881,304.5 innings over the past five years, this is a beautiful thing.
The Sox now lead the AL in run differential. Using that to project out the rest of the season combined with their record so far ... 102 wins.
What's gone right? More than anything it's been the team average on balls in play, currently .344. Second best is the Pirates at .328. That has been the foundation upon which this team has been winning games since they're middle of the pack in BB%, K%, and HRs (although rising). Bogaerts is rocking a .387, Shaw a .424, JBJ a .386, Ramirez a .366 and pretty much the whole team is above average except for Betts, Hannigan, and Holt (amusingly). Obviously balls won't keep falling in at this rate, but a continued run of above average BABIP would not surprise me at all considering some of the players and the park. Was wondering what the highest team BABIP in recent history was and I was surprised to find our beloved 2013 team's .329 is the highest mark since at least 1950. Lots of things going right so far.
A continued run of above average BABIP might be achievable because this lineup is hard to pitch to since it lacks a predictable profile By that I mean a fair amount of patience is leavened with aggressiveness very early in the count: see Ortiz vs. Betances for the HR or Hanley vs. Triggs last night for the double. Many of the hitters have also been doing a nice job foiling shifts, taking pitches away to the opposite field and finding the green spaces. The hitting coach seems to have them buying in to taking full swings through the ball which promotes balance and keeping the head on the pitch, helps generate hard contact, and reduces the tendency to just swing from the heels.What's gone right? More than anything it's been the team average on balls in play, currently .344. Second best is the Pirates at .328. That has been the foundation upon which this team has been winning games since they're middle of the pack in BB%, K%, and HRs (although rising). Bogaerts is rocking a .387, Shaw a .424, JBJ a .386, Ramirez a .366 and pretty much the whole team is above average except for Betts, Hannigan, and Holt (amusingly). Obviously balls won't keep falling in at this rate, but a continued run of above average BABIP would not surprise me at all considering some of the players and the park. Was wondering what the highest team BABIP in recent history was and I was surprised to find our beloved 2013 team's .329 is the highest mark since at least 1950. Lots of things going right so far.
Building on that, by hitters in hot streaks:A continued run of above average BABIP might be achievable because this lineup is hard to pitch to since it lacks a predictable profile By that I mean a fair amount of patience is leavened with aggressiveness very early in the count: see Ortiz vs. Betances for the HR or Hanley vs. Triggs last night for the double. Many of the hitters have also been doing a nice job foiling shifts, taking pitches away to the opposite field and finding the green spaces. The hitting coach seems to have them buying in to taking full swings through the ball which promotes balance and keeping the head on the pitch, helps generate hard contact, and reduces the tendency to just swing from the heels.
Pedey's BABIP bump is pretty much being completely driven by grounders through the right side. His medium and hard contact is exactly the same. When he tries to pull it with runners on, he has been grounding into more double plays (8 so far. 6 all of last year, and on pace for a career high). I hope he keeps going oppo, and when he pulls the ball, keeps it in the air.
Shaw is actually hitting the ball softer than last year (down 8% from last year). His BABIP is up from all the up the middle and opposite field hitting (68% this year, up from 58% last year) which probably makes him that much harder to defend.
Bogaerts is hitting fewer line drives and more grounders (5% difference for both), but the hard and medium contact is up. Him pulling the ball more is a good sign, so he's actually beating shifts that way. He could probably benefit the most from being ever more aggressive on first pitch fastballs middle in, since his power is almost purely pull/left center. His BABIP may just always be high because of how great his approach is.
Bradley has been maiming baseballs as we've seen (10% harder but more grounders), but the distribution has been exactly the same as last year. It's nice that Chili thinks he has changed in that regard and is encouraging it, but the numbers don't back it up unless it has happened a lot more during this hot streak which could be more likely and the reverse of what he was doing while slumping.
Papi's BABIP is 30 points higher than his career rate, and is up 66 points higher than last year. It's mostly from him hitting more flyballs, and higher velocity because his soft contact is exactly the same as normal. It probably isn't anywhere near sustainable.
He has actually been able to pull the ball with more authority as well, so he is beating shifts using the Ted Williams style but that has nowhere to go but down.
Hanley is doing what he did last year. Career norms of distribution and BABIP. He is still hitting with much less authority in his time in Boston. The bomb over everything was nice, but this wRC+ of 115 may be what he is at this point.
Summarizing - Pedey, Bogaerts and Shaw seem to have bought in completely to hitting them where they ain't. Papi has been lucky as all get out, but lofting the ball like crazy which is making up for it. Bradley is hitting the ball harder than ever and some may be permanent. Hanley may have plateaued.
Holt, Mookie, Vazquez, Hanigan, have room to improve.
One other interesting note, is that the only lefty vs lefty or righty vs righty weakness (aside from Chris Young) is Shaw's .172 vs lefties. Everyone else is at or well above career averages vs pitchers with the same handed-ness (Pedey .302 vs. RHP, JBJ .327 vs. LHP) In fact, all righties have not been hitting lefties anywhere near their norms yet.
That could also be factoring into the increased BABIP, is the change in approach to combat weaknesses in their usual platoon splits.
Last edited:
I think this is a great point.A continued run of above average BABIP might be achievable because this lineup is hard to pitch to since it lacks a predictable profile By that I mean a fair amount of patience is leavened with aggressiveness very early in the count: see Ortiz vs. Betances for the HR or Hanley vs. Triggs last night for the double. Many of the hitters have also been doing a nice job foiling shifts, taking pitches away to the opposite field and finding the green spaces. The hitting coach seems to have them buying in to taking full swings through the ball which promotes balance and keeping the head on the pitch, helps generate hard contact, and reduces the tendency to just swing from the heels.
Shifts are used because they suppress BABIP, and the adjustment against shifts is to go opposite field. The fact that each of the four guys cited above (Bogaerts, Shaw, Bradley, and Ramirez) have all been monsters to the opposite field is a good reason to think the team can continue as a somewhat high outlier to BABIP.
Not at the team's current .344 BABIP clip, of course. There will be regression as the Sox play more away games.
But I think ending the year a little worse than the 2013 team's .329 BABIP clip should reasonably remain within reach. Just like then, this team has multiple everyday LHH other than Ortiz who show HR power to pull at Fenway.
And the last 5 years, the top outlier teams have all hit well above the average BABIP.
2016 - BOS .344 (.297 average)
2015 - DET .322 (.299)
2014 - COL .326 (.299)
2013 - BOS .329 (.297)
2012 - COL .321 (.297)
Why not us?
He hasn't turned anything around. He's faced lefties. Updated:Even Chris Young has turned it around in the month of May (19PA I know I know) by hitting .375/.474/.563. Hitting is all the rage!
Vs RHP: 23PA, .136/.174/.182, 0BB/9K, 3 H, 1 2B, 1HBP.
Vs LHP: 25PA, .381/.480/.667, 4BB/5K, 8 H, 6 2B.
He is what he is.
Sox are #1 in the AL so far in Oppo% at 27.7% (league average 25.0%). Their Oppo% vs. "traditional shifts" (according to Fangraphs, the "Ted Williams shift" and minor variants) is 27.0% this year vs. 23.8% in 2015. This may help account for the eye-popping rise in their wRC+ vs. those shifts, from 74 in 2015 to 141 this year.Many of the hitters have also been doing a nice job foiling shifts, taking pitches away to the opposite field and finding the green spaces. The hitting coach seems to have them buying in to taking full swings through the ball which promotes balance and keeping the head on the pitch, helps generate hard contact, and reduces the tendency to just swing from the heels.
He was pretty suck ass against lefties in April.He hasn't turned anything around. He's faced lefties. Updated:
Vs RHP: 23PA, .136/.174/.182, 0BB/9K, 3 H, 1 2B, 1HBP.
Vs LHP: 25PA, .381/.480/.667, 4BB/5K, 8 H, 6 2B.
He is what he is.
I was actually looking at oppo% this morning, and it's interesting to go a bit granular and break it down by player. The increase is most notable for Pedey, Hanley, and Shaw.
Ramirez is hitting to opposite field at 36.1 percent, against 25.4 percent career average.
Pedey's oppo% is 34.2 v. 25.0 percent career average.
Shaw oppo% is 32.6%. Career numbers are not really relevant, and I suppose with a young player you have to ask whether in part it's due to not catching up to the fastball. Shaw has a pretty poor K% (over 25), but everything is SSS at this point, so just something to keep an eye on.
Holt is getting in on the act too -- he's traditionally been a bit of a spray hitter with a career cent%+oppo% of 61.8 (35.2/26.6), and he's at 66.8 this year (35.4/31.6). Same with Xander 28.3 oppo% v. 26.3 career.
Everyone else is right around their career averages for oppo%. Betts is consistently around 24 percent. JBJ has been more of a pull hitter (22.5 oppo%). And Papi's number shocked me (18.1 oppo% v. 24.5 career) because I thought he was going the opposite way more often this year. Vaz is 23.3 v. 27.6 career (again, very SSS) and Hanigan is at 25 versus a career of 29.2, which actually maybe is a good sign for a 35 year old catcher.
I thought so too. I'm guessing we both thought so because he's having a lot more success going the opposite way this year: .529 BABIP vs. .333 in 2015 (the latter number is right in line with his career average). I think we notice the opposite-field swings that result in hits a lot more than the ones that don't. He's due for a correction, because he's not hitting the ball harder going oppo, nor hitting more line drives. But he is hitting more doubles: 5 oppo doubles already, vs. 15 all of last year.And Papi's number shocked me (18.1 oppo% v. 24.5 career) because I thought he was going the opposite way more often this year.
No, he wasn't.He was pretty suck ass against lefties in April.
Should teams stop shifting on them to make the hitters adjust based on that eyepopping success. Is this a more general "to shift or not to shift " strategy adjustments if a player, set of players or team is consistently beating the shift? Do you have numbers on individual Sox players against the shift? If they exist can a manager use them in game like you would by pitching a batter a different way if you see you are no longer having success with the low and away breaking stuff that used to be his weakness, for example?Sox are #1 in the AL so far in Oppo% at 27.7% (league average 25.0%). Their Oppo% vs. "traditional shifts" (according to Fangraphs, the "Ted Williams shift" and minor variants) is 27.0% this year vs. 23.8% in 2015. This may help account for the eye-popping rise in their wRC+ vs. those shifts, from 74 in 2015 to 141 this year.
How much data would a manager need before figuring out that was working isn't anymore and could be worse than not shifting?
He was 3-8. The "issue" was that the Sox were giving him some spot starts against RHP.He was pretty suck ass against lefties in April.
.329 for the year seems eminently reasonable--good batters do influence their BABIP. And we've already booked some good luck. Even if we BABIP a league-average .299 going forward, we'll finish the year with a .311 overall.But I think ending the year a little worse than the 2013 team's .329 BABIP clip should reasonably remain within reach. Just like then, this team has multiple everyday LHH other than Ortiz who show HR power to pull at Fenway.
He had 27 PA *total* in April. If I'm counting right, his line against lefties was 3/10 3 2B, 2 BB. That's .300/.416/.600.He was pretty suck ass against lefties in April.
Update on Non-Sabre League Offensive stats as of today:
#1 in: Runs, Hits, Average, On Base %, Total Bases, Doubles, Triples, Slugging, OPS, Stolen Base %, Run Differential
Defense: Fielding %: #1 (tied)
Wins: #2 (tied)
Pitching:
No Effective Price
No Effective Buchholz
No Rodriguez
No Kelly
Smith Just Arrived
Koji Meh
Nowhere to go but up
Defense: solid
Managing: solid
Speed: solid
Bench: ?
WAR by position (Leader) - I don't understand these ratings:
C: No Rating (Perez)
1B: #8 (Davis)
2B: #5 (Altuve)
3B: #3 (Machado)
SS: #1
LF: #7 (Desmond)
CF: #3 (Trout, then Pillar) Really? Fuck that.
RF: #8 (Eaton)
DH: #1
Backup Color Commentator: minus infinity