I mean good for him in overcoming that mental block that otherwise would have prevented him from ever playing in the league…..but he is a pretty bad NBA player. He doesn’t have a plus NBA skill and is (maybe not even) arguably the worst shooting guard in the league this side of Simmons. Fultz is 1-9 on the year from three. He’s not long for this league if I had to guess.Fultz is an actual nba player now though. Can't shoot from three, and is not anywhere near the level of a 1st overall pick, but he has worked very hard to overcome whatever exactly it was that plagued him. We should celebrate him for that and not shit on him
2023-2024 General NBA Season Thread
- Thread starter BigSoxFan
- Start date
I'm on the Gravyson train. Knockdown shooter.He had 8 threes last game too. Allen has had a phenomenal season this year.
He's probably better than Bradley Beal at this point
Just for fun . . . .I mean good for him in overcoming that mental block that otherwise would have prevented him from ever playing in the league…..but he is a pretty bad NBA player. He doesn’t have a plus NBA skill and is (maybe not even) arguably the worst shooting guard in the league this side of Simmons. Fultz is 1-9 on the year from three. He’s not long for this league if I had to guess.
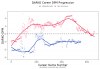
can we break this out by rim attempts versus other? he's shooting more threes this year so I'd imagine it's even worse than this shows.Jimmy Butler has a "getting blocked" problem. By year, % of FGAs blocked since going to Miami:
2020: 5.9%
2021: 5.7%
2022: 4.3%
2023: 6.0%
2024: 8.4% heading into tonight.
NBA bottom five in 4th quarter net rating:
26. WAS -3.1 (no surprise there)
27. DET -3.3 (ditto)
28. GSW -3.5 (hello, Kerr?)
29. MIA -5.7 (hello, Spoelstra??)
30. PHO -14.7 (what the f??????????)
Fwiw, BOS is #1 at +6.5.
26. WAS -3.1 (no surprise there)
27. DET -3.3 (ditto)
28. GSW -3.5 (hello, Kerr?)
29. MIA -5.7 (hello, Spoelstra??)
30. PHO -14.7 (what the f??????????)
Fwiw, BOS is #1 at +6.5.
Ted Cruz Jr. being this good is as annoying AF. Obviously his life is made easier by KD, Book, and Beal, but .475 from 3 on 324 attempts (6.1 per 36 minutes) is freaking ridiculous. Ah well ... at least I'm not a Bucks or Grizzlies fan.I'm on the Gravyson train. Knockdown shooter.
He's probably better than Bradley Beal at this point
(Yes, I did post this largely to refer to him as "Ted Cruz Jr.")
Curry-esqueTed Cruz Jr. being this good is as annoying AF. Obviously his life is made easier by KD, Book, and Beal, but .475 from 3 on 324 attempts (6.1 per 36 minutes) is freaking ridiculous. Ah well ... at least I'm not a Bucks or Grizzlies fan.
(Yes, I did post this largely to refer to him as "Ted Cruz Jr.")
Cruz doppelganger + Duke Natl Champion has thrown Grayson into John Kreese territory
And just the name GraysonCurry-esque
Cruz doppelganger + Duke Natl Champion has thrown Grayson into John Kreese territory
the whole package is a hangnail, but he is ballingAnd just the name Grayson
Last edited:
I think I'd rather be watching OKC-Heat than this TWolves Cavs game, but hard to argue with a 1 point game heading to the 4th. Whoever the stand-in coach is for the TWolves, it looks like they took a dude from the third row of the stands.
Heat @ Cavs spicy halfway thru thirdI think I'd rather be watching OKC-Heat than this TWolves Cavs game, but hard to argue with a 1 point game heading to the 4th. Whoever the stand-in coach is for the TWolves, it looks like they took a dude from the third row of the stands.
Gobert just got T’d up for making the money sign to the refs after being called for his 6th foul with under 30 seconds in a 1 pt game
That’s an incredible tech on Gobert. Did he just accuse the refs of taking money to throw the game?
I thought that was the universal sign for rolling a spleef?Gobert just got T’d up for making the money sign to the refs after being called for his 6th foul with under 30 seconds in a 1 pt game
Naz Reid doesn't get enough love
Ant Edwards can't stop chucking, my man is all about the hero ball
I think that’s exactly what he was insinuating. I haven’t been watching so don’t know if the officiating has been anything other than the NBA standardThat’s an incredible tech on Gobert. Did he just accuse the refs of taking money to throw the game?
Lillard just ISO'd down 1 with 3 seconds left and got stone cold blocked by Dinwiddle.
Let's put the Tatum hypercriticism on him, now!
Let's put the Tatum hypercriticism on him, now!
Things still setting up nicely in both conferences, although a potential 2nd round series against Orlando wouldn’t come without its set of issues.
But meanwhile in the west, I think the Wolves may fall to 4, which would potentially mean a Denver-Clips 2nd round series.
And finally, the Lakers and GS are still in the 9-10 slots, which is what we’re all rooting for for a high drama play in game.
Edit: and finally, a .500 or below record for Philly is still on the table!
That Celtics game was a fluke, and Wolves are minus KAT.Cavs are becoming a scary playoff opponent. Beat the Celtics and Wolves without Mitchell.
After starting the season 5-14, the Bulls are almost back to .500 (31-32)
It's almost as if the Bulls started playing better once Zach LaVine was replaced with Caruso in the lineup.
MAX money just doesn't buy what it used to.
Keeping a casual eye on Chicago as a First round matchup
It's almost as if the Bulls started playing better once Zach LaVine was replaced with Caruso in the lineup.
MAX money just doesn't buy what it used to.
Keeping a casual eye on Chicago as a First round matchup
The ref he made the gesture at was Scott Foster.Gobert just got T’d up for making the money sign to the refs after being called for his 6th foul with under 30 seconds in a 1 pt game
Its 2024 and this is worth a look. That's a T but its a glorious one
View: https://twitter.com/50NuancesDeNBA/status/1766486118562685420?t=8-Em4EgaG-70CiLJ4LwupA&s=19
View: https://twitter.com/50NuancesDeNBA/status/1766486118562685420?t=8-Em4EgaG-70CiLJ4LwupA&s=19
If we're just isolating individual recent games, they also recently lost to Atlanta without him and the Bulls with him.Cavs are becoming a scary playoff opponent. Beat the Celtics and Wolves without Mitchell.
They aren't a particularly scary opponent at all.
Point, Gobert. Though won't earn the benefit of the doubt on calls going foward...
Lmaooo wow. Would you say that he got his......money's worth on that T?Its 2024 and this is worth a look. That's a T but its a glorious one
View: https://twitter.com/50NuancesDeNBA/status/1766486118562685420?t=8-Em4EgaG-70CiLJ4LwupA&s=19
I love how in these threads quality opponents are routinely dismissed as nothing to be feared. Pretty sure we heard that about the Heat last season.If we're just isolating individual recent games, they also recently lost to Atlanta without him and the Bulls with him.
They aren't a particularly scary opponent at all.
Kudos.Lmaooo wow. Would you say that he got his......money's worth on that T?
And yeah, if you are going to get a T that's how you do it.
Yeah, the right attitude is probably closer to: "the NBA has never had more parity and elite talent. There are tons of teams that can get hot or figure out an identity and go on a run. There are also a lot of really scary players who are capable of figuring things out and being the best player in a given series. The fact that early-mid 30s stars seem to not age anymore only adds to that talent pool."I love how in these threads quality opponents are routinely dismissed as nothing to be feared. Pretty sure we heard that about the Heat last season.
I'm really sorry for having an opinion. I spend half my time in Cleveland and watch a lot of Cavs games. I don't think they'd match up well against the Celts in a short series, and especially not based on the two games mentioned. I didn't think the same about the Heat last season.I love how in these threads quality opponents are routinely dismissed as nothing to be feared. Pretty sure we heard that about the Heat last season.
At rim field goal attempts blocked for Jimmy Butler, last 5 seasons, LA= League Average:can we break this out by rim attempts versus other? he's shooting more threes this year so I'd imagine it's even worse than this shows.
2024: 10.10% LA: 9.85%
2023: 7.8% LA: 9.12%
2022: 4.56% LA: 9.62%
2021: 7.54% LA: 10.04%
2020: 9.06% LA: 10.09%
As context, SGA is at almost 11% field goal attempts blocked at the rim this year. The better metric might be FG% and Freq% at the rim. Getting blocked at the rim probably feels worse than it actually is relative to just missing the shot. But shots at the rim obviously go in at a higher percentage than any other shot on the floor. So frequency matters more. A low FG% probably captures more of what's going on. TS% at the rim probably captures even more so let's go with that.
Here are those %s for Butler -- restricted area frequency and TS% including FTAs from shooting fouls:
Year: Frequency: TS%: LA Freq: LA TS%
2024: 36% 73% 31% 69%
2023: 40% 74% 30% 70%
2022: 38% 73% 30% 69%
2021: 42% 74% 31% 67%
2020: 38% 71% 33% 67%
By this reckoning, Butler has had a slight dip in frequency but his TS% at the rim continues to be well above average.
I'll do Tatum's numbers as well since many people might be curious:
2024: 28% 72%
2023: 29% 74%
2022: 28% 73%
2021: 26% 73%
2020: 29% 63%
Similar TS% and much lower frequency as we would probably expect. He also gets to the line at a below average rate on those attempts, for those looking for ammo.
Court factors are an issue here as official scorers determine whether a shot occurs in the restricted area or outside but in the paint, and there's been some pretty measurable bias (especially in Chase center -- the scorer there is well known to have a bias against restricted area attempts).
Cavs have won six of their past seven games with the C's in Cleveland.I'm really sorry for having an opinion. I spend half my time in Cleveland and watch a lot of Cavs games. I don't think they'd match up well against the Celts in a short series, and especially not based on the two games mentioned. I didn't think the same about the Heat last season.
I don’t see how what happened several years ago with totally different teams tells us anything at all.Cavs have won six of their past seven games with the C's in Cleveland.
But regardless, respecting the fact that all playoff teams are good is different than finding them scary.
At least for me.
Last edited:
The Pacers have been pretty average for awhile now (12-14 since January 12), this won't help. With the Magic and Heat picking things up, they'll have a hard time staying out of the play in.
Boy if the seeding as it is today holds up, that would so terrific. CLE / MIL / MIA / PHI as the 2, 3, 6, and 7 seeds. And on the other side, we would all get to see the PHO / DAL / LAL / GSW play-in tournament superfecta.The Pacers have been pretty average for awhile now (12-14 since January 12), this won't help. With the Magic and Heat picking things up, they'll have a hard time staying out of the play in.
One can only dream though.
That Siakam trade is looking pretty ass right about now. Especially if he leaves anyway.The Pacers have been pretty average for awhile now (12-14 since January 12), this won't help. With the Magic and Heat picking things up, they'll have a hard time staying out of the play in.
They had won 7 of 10 prior to hitting the road last week and have lost 3 of 4 since…..which is the 7th separate time this year they has lost 3 out of 4 games. They’ve been 5-6 games over .500 pretty much all year and are 35-29 now.The Pacers have been pretty average for awhile now (12-14 since January 12), this won't help. With the Magic and Heat picking things up, they'll have a hard time staying out of the play in.
View: https://youtu.be/9kRpS8mwJ14?si=v_ExzXpiAorCZI2w
It's more Haliburton. He missed 8 of those 26 (Pacers went 4-4 with him on the bench), and he's averaged 16/3/9 while shooting .449 from the field and .317 from 3 (compared to 24/4/13 while shooting .497 from the field and .403 from 3 before this stretch). I don't know if it's injuries or a slump or regression or some combination, but the guy that looked like a higher scoring version of Steve Nash for the first few months of the year just hasn't existed for awhile.That Siakam trade is looking pretty ass right about now. Especially if he leaves anyway.
Both Kawhi and George out vs the Bucks. Not a surprise (they played 38 and 40 minutes last night against the Bulls), but still pretty disappointing for a matchup between two top five teams (at least by title odds).
*edit - and credit where it's due, Harden hasn't missed a game since his debut with the Clippers. 58 straight at his age is no joke.
*edit - and credit where it's due, Harden hasn't missed a game since his debut with the Clippers. 58 straight at his age is no joke.
Still in the honeymoon period. When they don't put the feng shui crystals in the right spot during this offseason, or perhaps the next offseason, he'll lose his s**t and start to mope and all of a sudden there will be a Hellenic Flu epidemic running through their locker room.*edit - and credit where it's due, Harden hasn't missed a game since his debut with the Clippers. 58 straight at his age is no joke.
When the trade happened, pretty much everyone here agreed that it would probably fall apart for personality reasons inside 3 years, but could work for a decent while until then.
A bigger fine than you get for making contact with an official. The lady doth protest too much, methinks.Gobert got fined 100k.
Haven't been watching but, my, that score. Both teams must have abysmal shooting percentages.Sixers and Knicks setting the game of basketball back about 50 years right now
Neither gets to 40 at the half! I’ve been half watching and thought it was the 1Q until a minute ago.Haven't been watching but, my, that score. Both teams must have abysmal shooting percentages.
Miami loses by 2 at home to the Wiz. Another data point in HRB’s theory about teams playing poorly at home after a long road trip perhaps?
Heat lose to the Wizards. It got really tight at the end (Wizards were up 10 with just over 2 minutes left, Miami missed a couple 3's in the closing seconds that would have won it), but for all the "here come the Heat" takes we've seen over the last few days, this was a really ugly loss and their 3rd straight. Kuzma is just such a losing player (he had a nice game, but was 0-2 with 2 turnovers and a shooting foul in the final 2 minutes), I can't believe he was once a key player on a title team. When Duncan Robinson isn't hitting his 3's (he was 4-13 tonight, 0-3 in the final minute) he's a real problem for Miami.
Best part was the Heat announcers during that 8-0 run. “And the Heat fans are out of their seats!!!”Heat lose to the Wizards. It got really tight at the end (Wizards were up 10 with just over 2 minutes left, Miami missed a couple 3's in the closing seconds that would have won it), but for all the "here come the Heat" takes we've seen over the last few days, this was a really ugly loss and their 3rd straight. Kuzma is just such a losing player (he had a nice game, but was 0-2 with 2 turnovers and a shooting foul in the final 2 minutes), I can't believe he was once a key player on a title team. When Duncan Robinson isn't hitting his 3's (he was 4-13 tonight, 0-3 in the final minute) he's a real problem for Miami.
Yeah. They were in the parking lot after falling behind by 10.