Jon Lester is a Cub. Lets us all cry together. What went wrong? Why did the Red Sox "lowball him"? How much did he raise his stock him 2014? Where was the 2014 Lester from 2011-2013? Let dig into this. Here I will try to figure out what happened…..and why the Red Sox maybe regret losing him
Table 1
Jon Lester
fWAR/Season
fWAR rank
FIP
FIP rank
K%
K% rank
Contact %
Contact% Rank
2009-2010
5.75
9th
3.14
10th
26.4%
2nd
76.1%
7th
2011-2013
3.63
16th
3.84
60th
20.4%
48th
80.9%
68th
2014
6.1
6th
2.80
9th
24.9%
12th
78.6%
29th
Lester was one of the top pitchers in the game during the 2009 and 2010 seasons, and even placed 4th in AL Cy Young voting in 2010. His peers were Felix Hernandez and Adam Wainwright, along with Lincecum and Sabathia (before they became husks of their former selves on the mound). While WAR still treated Lester well in 2011-2013, partially due to the sheer number of IP and park and league statistical adjustments, his FIP placed him in the leagues of Kyle Lohse, Homer Bailey, Yovani Gallardo and Ian Kennedy. During that period, Lester’s opponent contact rate and swinging-strike rate were the same as those of Clay Buchholz. So comparing a theoretical Lester deal to the Bailey extension, which was looked at as an overpay by some, didn’t seem unfair.
What caused Lester to fall from the ranks of the elite and become more of a number-two starter? The strikeouts disappeared.


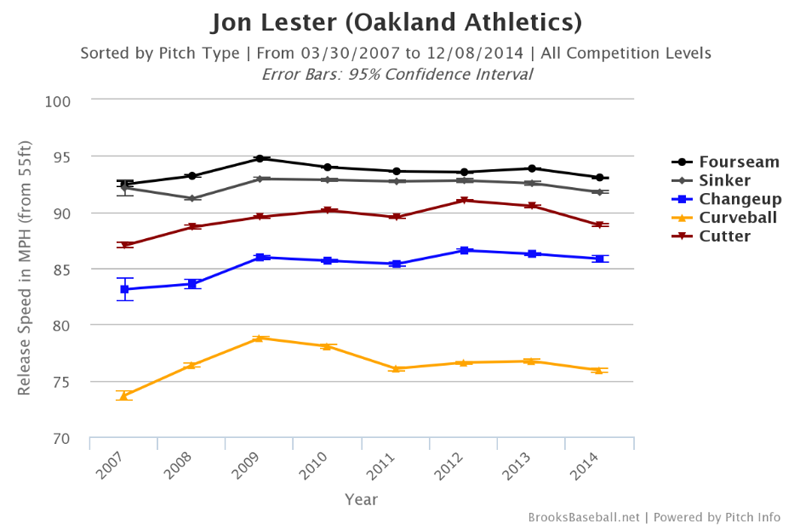
The problem was especially apparent against righties, whom he struck out at only a 17.9% clip in 2013 (compared to 26.3% in 2010). What caused this decline? Let’s take a quick look at the Pitch F/X data. A lot of people are under impression that the decline was due to velocity loss that occurs with aging. This isn’t really the case for Lester. Lester’s fastball velocity has declined by less than one mile per hour, from 94 MPH in 2010 to 93.2 MPH in 2014. While the cutter and curveball have lost velocity, they aren’t as dependent on velocity as the fastball:

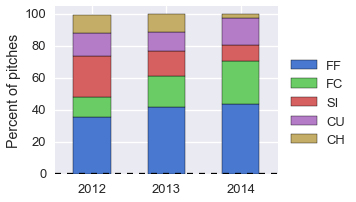
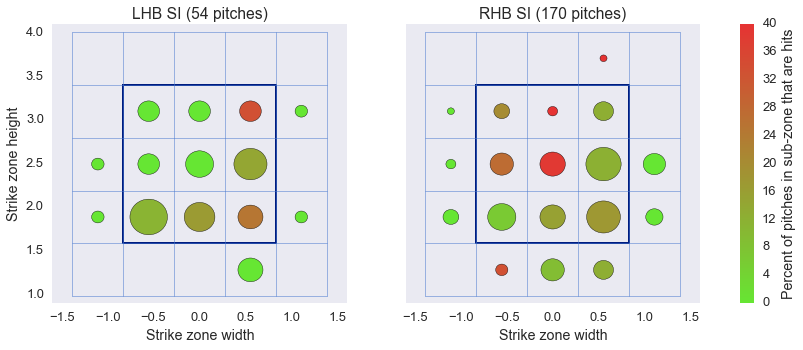
If we take a look at his pitch usage, we notice two things: He has for the most part ditched the sinker and changeup in favour of the fastball, cutter, curveball combination that our Matt Trueblood detailed in his recent piece.
Let’s take a look for the most telling data for any pitcher: The ability to get hitters to swing and miss.

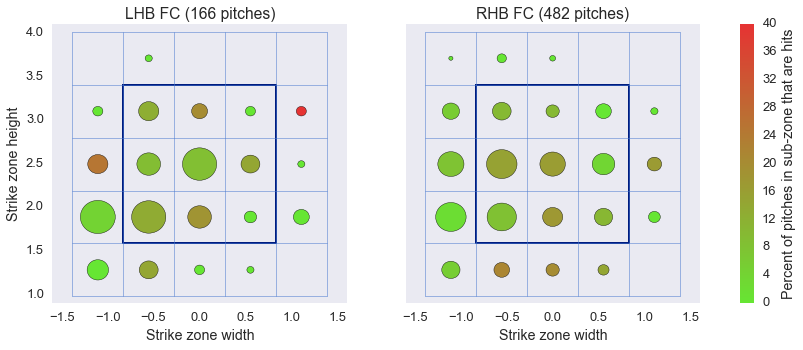
Lester’s fastball generated whiffs on 16.3 percent of all swings in 2014, his best mark since 17.8 percent in 2010. That is around the league average of 16.4 percent, according to Eno Sarris’s benchmarks. The cutter, which he is throwing at a career-high frequency of 31.0% of all his pitches, is generating a whiff-per-swing rate of 23.8 percent (5th in MLB, minimum 500 pitches thrown), above the league average of 21.4%. The pitch isn’t as good as it used to be, when it generated whiffs on over 28 percent of swings, for reasons Sarris detailed last year. However, it’s still a very good pitch that was even better in 2014 due to improvements in the horizontal movement.
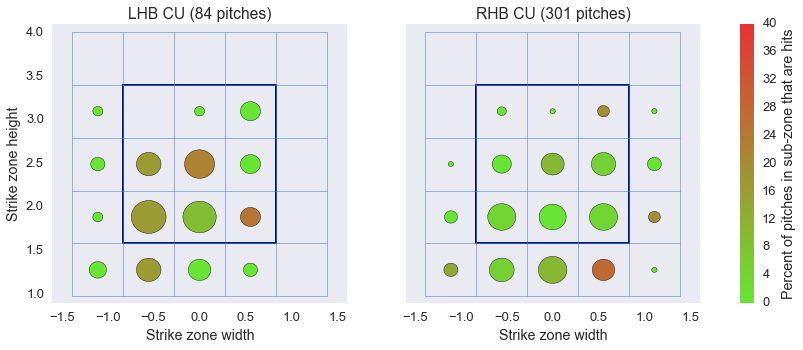
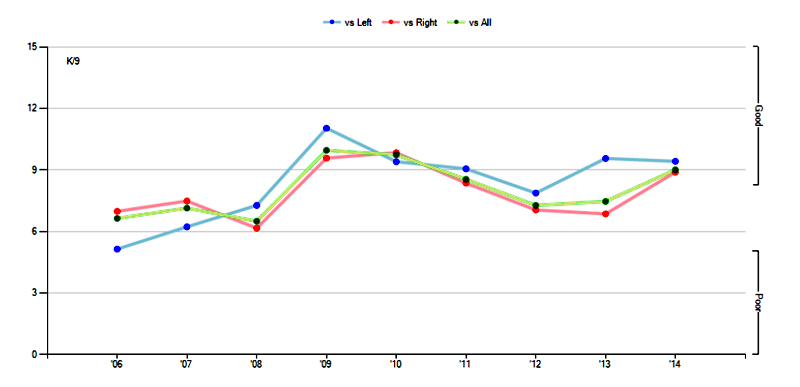
The curveball, though, is what’s special. In 2014, Lester’s curveball generated whiffs- per-swing on 40.81 percent of opponents’ swings, the highest mark of his career—and 12 percentage points more than in 2013, when his curveball was league-average in that regard. It was the best curveball in the league in terms of whiffs per swing, with pitchers like A.J. Burnett, Adam Wainwright and Sonny Gray behind him.
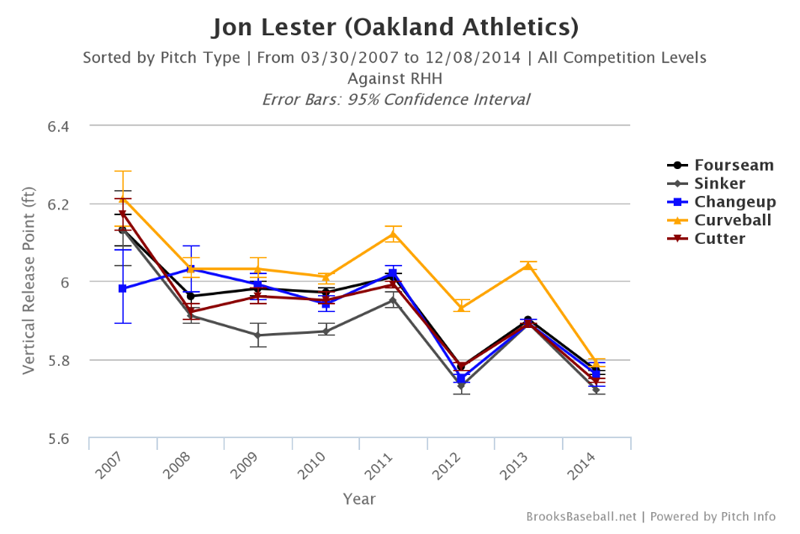
Now what happened to the curveball? It didn’t gain velocity. It didn’t gain movement. It gained a more consistent vertical release point. Look at 2014. Lester changed his release point on all pitches, but as you can see, the release points of the fastball, cutter, and curveball are tightly grouped together. Now look at 2009 and 2010, and compare it to 2011-2013. It appears that in his “peak years,” Lester maintained a better-disguised release point on the curve than he did in 2011-2013.
If the curveball was being tipped or was less deceptive, righties would have the best look at it. Let’s check that out:


There is something incredibly satisfying in finding the results we might expect. The Curveball generated 41.4% Whiffs/Swing vs. righties compared to the 25.8% in 2013. Lester’s Curveball caused 25 Ks against righties, 6th in baseball compared to 2014 when it only caused 6. This is exceptional because he only generated 55 Whiffs on the CB vs. RHH. When righties do make contact, they aren’t hitting it hard, only slugging .151 against the hook last year, compared to .338 in 2013. Righties aren’t picking up the curveball like they were before, and in 2014, that solved the platoon issues he had against them in previous years. Trueblood said, “Lester might have tapped into something that will allow him to dominate right-handed batters in the future.” That something is the curveball.
The gist is that 2014 Jon Lester was more like 2009-2010 Jon Lester than 2011-2013 Jon Lester. A mechanical adjustment allowed the curveball to reemerge as an elite weapon in Lester’s arsenal, complementing a very good cutter and an above average fastball. It also allowed him to enjoy success versus righties again. The question is: How sustainable is this change? If Lester can lose his mechanics for years, is there serious risk of him losing them again? Can he continue to improve? If he can bring the curveball back to its former glory, can he regain a bit more movement on the cutter again? Can he bring back an effective sinker, giving him a deeper arsenal? These are the questions on which the Cubs will be betting $155 million on. Lester simply bet on himself and made real changes that the Red Sox might have not seen until it was too late. If these changes can be sustained, it wouldn’t surpise me if Lester is easily worth the contract barring injury. Just one 5 WAR season can be worth $40M on this market. So long Lester....It really is a shame because I really like what I see and. hope you continue to dominate.
Table 1
Jon Lester
fWAR/Season
fWAR rank
FIP
FIP rank
K%
K% rank
Contact %
Contact% Rank
2009-2010
5.75
9th
3.14
10th
26.4%
2nd
76.1%
7th
2011-2013
3.63
16th
3.84
60th
20.4%
48th
80.9%
68th
2014
6.1
6th
2.80
9th
24.9%
12th
78.6%
29th
Lester was one of the top pitchers in the game during the 2009 and 2010 seasons, and even placed 4th in AL Cy Young voting in 2010. His peers were Felix Hernandez and Adam Wainwright, along with Lincecum and Sabathia (before they became husks of their former selves on the mound). While WAR still treated Lester well in 2011-2013, partially due to the sheer number of IP and park and league statistical adjustments, his FIP placed him in the leagues of Kyle Lohse, Homer Bailey, Yovani Gallardo and Ian Kennedy. During that period, Lester’s opponent contact rate and swinging-strike rate were the same as those of Clay Buchholz. So comparing a theoretical Lester deal to the Bailey extension, which was looked at as an overpay by some, didn’t seem unfair.
What caused Lester to fall from the ranks of the elite and become more of a number-two starter? The strikeouts disappeared.
The problem was especially apparent against righties, whom he struck out at only a 17.9% clip in 2013 (compared to 26.3% in 2010). What caused this decline? Let’s take a quick look at the Pitch F/X data. A lot of people are under impression that the decline was due to velocity loss that occurs with aging. This isn’t really the case for Lester. Lester’s fastball velocity has declined by less than one mile per hour, from 94 MPH in 2010 to 93.2 MPH in 2014. While the cutter and curveball have lost velocity, they aren’t as dependent on velocity as the fastball:
If we take a look at his pitch usage, we notice two things: He has for the most part ditched the sinker and changeup in favour of the fastball, cutter, curveball combination that our Matt Trueblood detailed in his recent piece.
Let’s take a look for the most telling data for any pitcher: The ability to get hitters to swing and miss.
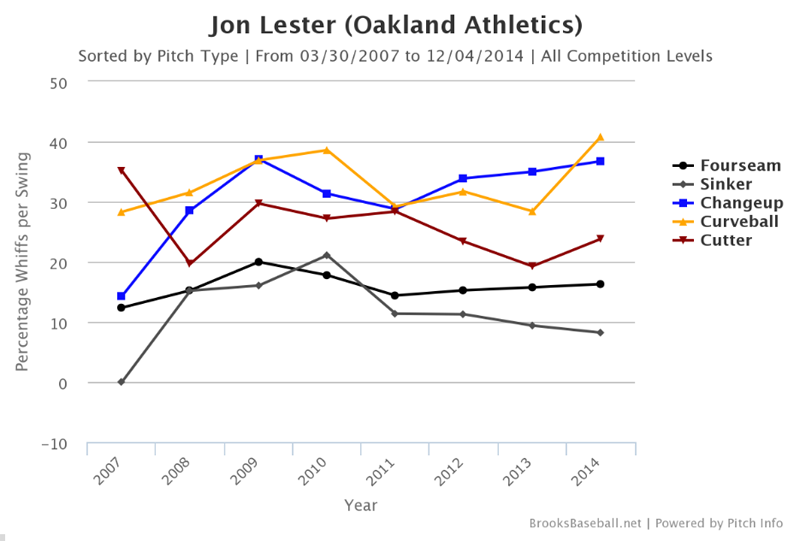
Lester’s fastball generated whiffs on 16.3 percent of all swings in 2014, his best mark since 17.8 percent in 2010. That is around the league average of 16.4 percent, according to Eno Sarris’s benchmarks. The cutter, which he is throwing at a career-high frequency of 31.0% of all his pitches, is generating a whiff-per-swing rate of 23.8 percent (5th in MLB, minimum 500 pitches thrown), above the league average of 21.4%. The pitch isn’t as good as it used to be, when it generated whiffs on over 28 percent of swings, for reasons Sarris detailed last year. However, it’s still a very good pitch that was even better in 2014 due to improvements in the horizontal movement.
The curveball, though, is what’s special. In 2014, Lester’s curveball generated whiffs- per-swing on 40.81 percent of opponents’ swings, the highest mark of his career—and 12 percentage points more than in 2013, when his curveball was league-average in that regard. It was the best curveball in the league in terms of whiffs per swing, with pitchers like A.J. Burnett, Adam Wainwright and Sonny Gray behind him.
Now what happened to the curveball? It didn’t gain velocity. It didn’t gain movement. It gained a more consistent vertical release point. Look at 2014. Lester changed his release point on all pitches, but as you can see, the release points of the fastball, cutter, and curveball are tightly grouped together. Now look at 2009 and 2010, and compare it to 2011-2013. It appears that in his “peak years,” Lester maintained a better-disguised release point on the curve than he did in 2011-2013.
If the curveball was being tipped or was less deceptive, righties would have the best look at it. Let’s check that out:
There is something incredibly satisfying in finding the results we might expect. The Curveball generated 41.4% Whiffs/Swing vs. righties compared to the 25.8% in 2013. Lester’s Curveball caused 25 Ks against righties, 6th in baseball compared to 2014 when it only caused 6. This is exceptional because he only generated 55 Whiffs on the CB vs. RHH. When righties do make contact, they aren’t hitting it hard, only slugging .151 against the hook last year, compared to .338 in 2013. Righties aren’t picking up the curveball like they were before, and in 2014, that solved the platoon issues he had against them in previous years. Trueblood said, “Lester might have tapped into something that will allow him to dominate right-handed batters in the future.” That something is the curveball.
The gist is that 2014 Jon Lester was more like 2009-2010 Jon Lester than 2011-2013 Jon Lester. A mechanical adjustment allowed the curveball to reemerge as an elite weapon in Lester’s arsenal, complementing a very good cutter and an above average fastball. It also allowed him to enjoy success versus righties again. The question is: How sustainable is this change? If Lester can lose his mechanics for years, is there serious risk of him losing them again? Can he continue to improve? If he can bring the curveball back to its former glory, can he regain a bit more movement on the cutter again? Can he bring back an effective sinker, giving him a deeper arsenal? These are the questions on which the Cubs will be betting $155 million on. Lester simply bet on himself and made real changes that the Red Sox might have not seen until it was too late. If these changes can be sustained, it wouldn’t surpise me if Lester is easily worth the contract barring injury. Just one 5 WAR season can be worth $40M on this market. So long Lester....It really is a shame because I really like what I see and. hope you continue to dominate.
 R version?