Unless I'm mistaken, the 2022 salary cap is based on 2021 revenue not a projection of 2022 revenue, so the Amazon package would increase revenue starting in 2022, & increase the salary cap starting in 2023.Amazon starts this year, but the other new deals kick in for 2023. I think we're both correct as to why the cap increased this year.
https://www.cnbc.com/2021/05/03/amazons-thursday-night-football-package-will-begin-in-2022-instead-of-2023.html
Salary Cap Percentages: Anatomy and Philosophy of Roster Building
- Thread starter JM3
- Start date
While doing literally no research, I would guess that it would roughly resemble a reverse bell curve with teams that pay the most & least doing best.The interesting next step in this research (if it has not yet been done) is to look at the relationship between QB salary as a share of the cap and team success, either for all teams or just for playoff teams.
Right, but the question would be whether there are thresholds/ranges and what those are.While doing literally no research, I would guess that it would roughly resemble a reverse bell curve with teams that pay the most & least doing best.
I think this is overcomplicating things to an extent. If you have a 26 year old Josh Allen/Patrick Mahomes and he's looking for an extension, you pay whatever he wants and hope he doesn't get hurt and the cap hit is okay in the first 25% of the deal and the final 25%. You're never going to move on from that kind of player because he'll take up 20% of your cap for four seasons or whatever. At least I wouldn't do it in a million years. The problem arises when you give out that kind of money to guys who are clearly below that level of talent.
This is an interesting theory, and one that could likely be proved with enough time to parse thru all the data. For example, I think you would need to come up with a way of valuing performance akin to the cost of WAR in baseball. Then you could see how much teams paid for the performances they received, factoring in dead money.Cant' recall the podcast--maybe something with Robert Mays--but I heard someone saying that an unnamed GM articulated the salary cap in a way that made to sense to me.
As I recall it the explanation was: The cap is [I don't recall, say 175 million]. You're not going to win much with a 175 million roster. To win a superbowl your roster need to play like you have 225 million worth of players playing . So you need find that extra value somehow--rookies on cheap contracts playing well, not losing much value to injury, cheap vets outperforming their contracts, something.
I think that's roughly right. Indeed when you look at a lot of the underdog super bowl winners you see teams like the Ravens or Giants where they got a ton of that kind of outperformance by QB who played like absolute studs in the post season. Or you get the Pats getting a lot of surplus value from Brady.
Anyhow I think the point is you have to get that value from somewhere and if you are paying a good QB a lot that's probably fine but you need to do a pretty great job at roster construction everywhere else because it's going to be really hard for even a Mahomes or Allen to consistently play above a 40 or 50 million salary.
The point is they had $47 MM or whatever less cap space to spend on the rest of the roster, but put together a super-bowl-winning team anyway. It's just one data point though.But "QB dead money" is no different than dead money for any other type of player.
My original point was just that 2022 could be the highest Super Bowl equity that the Bills will have during the Josh Allen era because he's going to cost so much more in 2023.I think this is overcomplicating things to an extent. If you have a 26 year old Josh Allen/Patrick Mahomes and he's looking for an extension, you pay whatever he wants and hope he doesn't get hurt and the cap hit is okay in the first 25% of the deal and the final 25%. You're never going to move on from that kind of player because he'll take up 20% of your cap for four seasons or whatever. At least I wouldn't do it in a million years. The problem arises when you give out that kind of money to guys who are clearly below that level of talent.
I explicitly said that you sign those QBs to those contracts 100 times out of 100. It's just the reality is the best chance to have a complete team is when you're paying much less $ against the cap for the same player.
There are a couple reasons to believe it is not going to be a bell curve. The most intuitive for me is this Bill James idea that football skill is itself a bell curve, but professionals are sampled from the tail, so the distribution of relative talent differential is not itself going to be normally distributed and will tend to concentrate itself towards mediocrity / below mediocrity, which conforms with my perception of how QB play generally shakes out in the NFL.While doing literally no research, I would guess that it would roughly resemble a reverse bell curve with teams that pay the most & least doing best.
The other obvious factor is rookie scale salaries.
That's why I said reverse bell curve - really cheap & really expensive QBs should have a better W-L record than average priced QBs.There are a couple reasons to believe it is not going to be a bell curve. The most intuitive for me is this Bill James idea that football skill is itself a bell curve, but professionals are sampled from the tail, so the distribution of relative talent differential is not itself going to be normally distributed and will tend to concentrate itself towards mediocrity / below mediocrity, which conforms with my perception of how QB play generally shakes out in the NFL.
The other obvious factor is rookie scale salaries.
I missed that key word "reverse". I promise to read good one day.That's why I said reverse bell curve - really cheap & really expensive QBs should have a better W-L record than average priced QBs.
Fwiw I think my initial thought is probably not a great thought either - tanking teams will also have a low % spent on QB, & teams at the end of a run will have a really expensive QB often.
Here's a 2021 scatter plot showing what % a team spent of their cap on QBs & how many wins they had. It seems...non-conclusive.
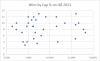
Here's a 2021 scatter plot showing what % a team spent of their cap on QBs & how many wins they had. It seems...non-conclusive.
Breaking down that data in a couple different ways...
Here are the teams which spent 5% or less of their cap on QB:
10 teams, average 7.6 wins. Obviously dragged down by incompetent teams like the Jets/Jaguars/Giants.
Mahomes & Burrow just barely qualified for this group or it would have been uglier.
5.01% to 10%:
12 teams, average 8.9 wins. Worst teams in this sector were the Lions (Goff vastly overpaid), Panthers (Cam & Darnold) & Bears (Foles, Dalton & Fields).
Bucs got a nice, cheap, Brady year, Cowboys got Dak's contract before it exploded, same for Bills & Titans.
10.01% to 15% is a small group:
4 teams, average 8.8 wins. Includes the SB winner, and the average would be even higher if the Texans weren't paying Watson to not play.
15.01%+
6 teams, average 8.8 wins. Main takeaway from this list is Tomlin must be a really good coach. Shanahan, too.
So the 4 sections:
5% or less: 7.6 wins
10% or less: 8.9 wins
15% or less: 8.8 wins
More than 15%: 8.8 wins
Here are the teams which spent 5% or less of their cap on QB:
| Year | Team | QB Cap % | Wins |
|
2021 |
Eagles |
1.27% |
9 |
|
2021 |
Ravens |
2.18% |
8 |
|
2021 |
Patriots |
2.26% |
10 |
|
2021 |
Broncos |
3.50% |
7 |
|
2021 |
Jets |
3.75% |
4 |
|
2021 |
Jaguars |
4.23% |
3 |
|
2021 |
Chargers |
4.67% |
9 |
|
2021 |
Giants |
4.73% |
4 |
|
2021 |
Chiefs |
4.96% |
12 |
|
2021 |
Bengals |
5.00% |
10 |
10 teams, average 7.6 wins. Obviously dragged down by incompetent teams like the Jets/Jaguars/Giants.
Mahomes & Burrow just barely qualified for this group or it would have been uglier.
5.01% to 10%:
|
2021 |
Cardinals |
5.77% |
11 |
|
2021 |
Dolphins |
6.03% |
9 |
|
2021 |
Saints |
6.17% |
9 |
|
2021 |
Titans |
6.23% |
12 |
|
2021 |
Panthers |
6.25% |
5 |
|
2021 |
Commanders |
6.60% |
7 |
|
2021 |
Bills |
6.75% |
11 |
|
2021 |
Lions |
7.02% |
3.5 |
|
2021 |
Buccaneers |
7.44% |
13 |
|
2021 |
Bears |
7.94% |
6 |
|
2021 |
Browns |
8.47% |
8 |
|
2021 |
Cowboys |
9.03% |
12 |
12 teams, average 8.9 wins. Worst teams in this sector were the Lions (Goff vastly overpaid), Panthers (Cam & Darnold) & Bears (Foles, Dalton & Fields).
Bucs got a nice, cheap, Brady year, Cowboys got Dak's contract before it exploded, same for Bills & Titans.
10.01% to 15% is a small group:
|
2021 |
Rams |
11.50% |
12 |
|
2021 |
Colts |
11.53% |
9 |
|
2021 |
Texans |
11.79% |
4 |
|
2021 |
Raiders |
13.47% |
10 |
4 teams, average 8.8 wins. Includes the SB winner, and the average would be even higher if the Texans weren't paying Watson to not play.
15.01%+
|
2021 |
Falcons |
15.90% |
5 |
|
2021 |
Steelers |
15.93% |
9.5 |
|
2021 |
Packers |
16.05% |
13 |
|
2021 |
49ers |
16.65% |
10 |
|
2021 |
Vikings |
17.77% |
8 |
|
2021 |
Seahawks |
18.22% |
7 |
6 teams, average 8.8 wins. Main takeaway from this list is Tomlin must be a really good coach. Shanahan, too.
So the 4 sections:
5% or less: 7.6 wins
10% or less: 8.9 wins
15% or less: 8.8 wins
More than 15%: 8.8 wins