Contrived stats and other discussion about metrics

BaseballJones

ivanvamp
SoSH Member
Oct 1, 2015
24,661
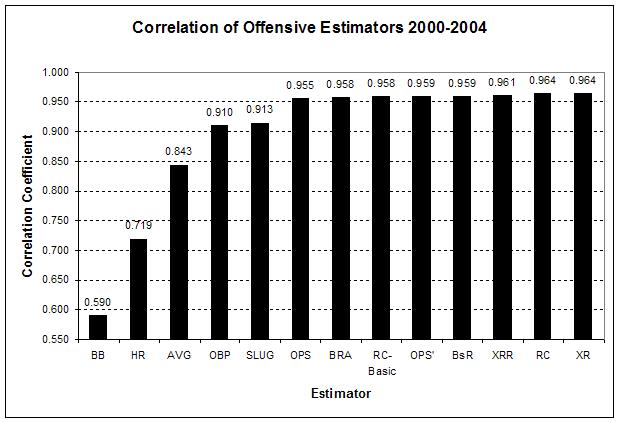
I was thinking of this as I was posting about JBJ's crazy great numbers over the last 90 or so games in his career. A number that gets thrown around a lot is OPS, and it's quick, easy, and almost every baseball fan knows exactly what it refers to: the addition of on-base percentage plus slugging percentage. It's pretty easy to compare players with this number, and it has many advantages. But it also seems pretty contrives. That is, it doesn't really tell us much, does it? Just looking at a player's OPS number doesn't tell us whether the player is a low OBP person with a high SLG, or a high OBP and a low SLG, or something in the middle. Moreover, if I recall correctly, the prevailing wisdom is that OBP is much more important than SLG, so how helpful is it, anyway, to simply add on-base plus slugging, without contextualizing for the relative weight of each category?

Now think of that, and then think of the world of metrics in baseball. Some things measure clear and informative data. Batting average measures hits divided by at-bats. Whether we think it's a helpful stat or not, it does tell us something pretty clear. On the contrary, WAR is like a black box metric. I think it takes into account pretty much everything that a player does, but I have no idea how to calculate it.

So the question is, which stats or metrics do you find to be the most useful and informative? What are your "go-to" stats when evaluating a player? And what do you find to be some of the least useful or least informative metrics or stats?
 

geoduck no quahog

not particularly consistent
Lifetime Member
SoSH Member
Nov 8, 2002
13,024
Seattle, WA
The only stat I look at for relievers is WHIP. I imagine there are better ones like strikeout rate, walk rate and whatever stat it is that addresses "hard" contact, but really - the job of a reliever is to minimize the possibility of every batter he faces getting on base. I guess this is also skewed by the meme of bringing closers in for a clean inning (as opposed to lower quality middle relievers who often come in with players on base, often in scoring position - does that make any sense?). Still - I 'd like to see a "reliever" stat that somehow combines other stats to produce something that clearly shows how good a pitcher is at avoiding damage, one that isn't tied to luck and rewards relievers for minimizing damage.

{something that includes BAA, K/BB, Slugging Against (I guess, maybe iso against?), inherited runners advanced...I don't know}
 

dbn

Member
SoSH Member
Feb 10, 2007
7,785
La Mancha.
This isn't really addressing the questions asked in the OP but, as I've said before, I'd love to see confidence intervals on stats. One problem is that they wouldn't be simple to compute. However, I think it'd be pretty straightforward to code. Maybe I'll take a crack at it, but it wouldn't be that useful unless I could put the calculator on line somewhere so people could use it. If someone knows how to do that, PM me and maybe we could do a quick project.

edit to elaborate a bit:

For example, with a stat like OPS one could use the number of PAs to set upper and lower CIs on rates such HR/PA, BB/PA, etc., and propagate those CIs through.
 

crystalline

Member
SoSH Member
Oct 12, 2009
5,771
JP
Your objection to OPS is that its units are not easily interpretable.

Analysts realized this years ago, and they started expressing stats not in arbitrary units, but in units of _runs_. In other words: given a particular value of a stat, how many runs is that worth over a guy who you could get for free and slot in?

OPS expressed in units of runs is the idea for RC, or linear weights. http://www.fangraphs.com/library/principles/linear-weights/

So why use runs as the unit? Because runs largely are interchangeable, in baseball, for wins. Actually, about ten runs equals one win. And most of the time when we look at numbers, we care about predicting how much a given player helps the team win.

WAR _is_ in units of wins. That's the right unit. The problem with WAR is that, beyond its units, it tries to incorporate a whole lot of other things that OPS does not. So basically you are looking in your post for something like OPS but in units of runs or wins. That's why James developed RC.


---

On a related note: it would be great also to express football stats in tangible units: of points scored, or wins added. (Basketball stats have tried to do that when possible: plus minus, or PER - they are not necessarily great stats but they have real units which is good.) The problem in football is that it's very hard to say how much a given player is responsible for a given play. Is it Brady or Moss or the OL or Belichick that's most responsible for a given touchdown? So you can calculate stats in terms of points, and you can try to assign value to players and plays, but you will often be wrong. Which is why I suspect football stats often use arbitrary units. Moreover, in football, yards don't well predict points which don't well predict wins. At least not as accurately as 10 runs equal a win in baseball. So in football, the real unit you want for all your stats is the win. (Or say, log prob win)
 
Last edited:

dbn

Member
SoSH Member
Feb 10, 2007
7,785
La Mancha.
Getting back to the OP, IIRC The Book claims that 1.7 x OBP + SLG correlates better with run production than straight OPS. One thing that I don't like about OPS is that OBP and SLG aren't independent, so OPS double-counts things. Maybe someday things like runs created (RC) will be widely used. (Or, what crystalline said just before I posted this.)
 

crystalline

Member
SoSH Member
Oct 12, 2009
5,771
JP
This isn't really addressing the questions asked in the OP but, as I've said before, I'd love to see confidence intervals on stats. One problem is that they wouldn't be simple to compute. However, I think it'd be pretty straightforward to code. Maybe I'll take a crack at it, but it wouldn't be that useful unless I could put the calculator on line somewhere so people could use it. If someone knows how to do that, PM me and maybe we could do a quick project.

edit to elaborate a bit:

For example, with a stat like OPS one could use the number of PAs to set upper and lower CIs on rates such HR/PA, BB/PA, etc., and propagate those CIs through.
I don't think it would be that hard to do this. The problem is teaching all Americans enough prob+stat so they can interpret confidence intervals. Physicists screwed up everything when they demanded the first advanced math class everyone should take is calculus, not probability and statistics.

Maybe you can start by getting weather stations to give a confidence interval on their temperature predictions. ("Your 95% CI for tomorrow's temp is 65-72F. Your 95% interval for next Friday's temp is 42-91F".)
 

dbn

Member
SoSH Member
Feb 10, 2007
7,785
La Mancha.
Right. By "not simple to compute" I meant that the average baseball fan wouldn't be able to do it. That's why I thought it'd cool to put a calculator on a website or something. People could cut-and-paste csv data into a window and they'd get an OPS (or whatever) with CIs. Anyhow, probably no one would use it and it'd be a waste of time. I might code something up anyway just because it might be a fun way to waste an hr or two.
 

StupendousMan

Member
SoSH Member
Jul 20, 2005
1,925
You might find this article on our sister site somewhat relevant.

Yes, it's true that the combination (OBP + SLG) = OPS does not correlate as well with runs produced as a slightly different combination, such as (1.7*OBP + SLG). On the other hand, it's much easier to compute the equally-weighted version. I guess most people find the convenience outweighs its slightly less predictive qualities.
 

smastroyin

simpering whimperer
Lifetime Member
SoSH Member
Jul 31, 2002
20,684
The thing with OPS is that it is simple to compute and correlates well on a team level with run scoring.

Here's a link to a Hardball times article about various correlations.


So you have a huge improvement going to OPS, and then marginal improvement afterward. It's much more important to account for playing time than it is to get increased resolution from the advanced stats.

(Please note this is correlaton coefficient which means you need to square it to get the R^2 you are used to seeing)
 

moondog80

heart is two sizes two small
SoSH Member
Sep 20, 2005
8,213
The thing with OPS is that it is simple to compute and correlates well on a team level with run scoring.

Here's a link to a Hardball times article about various correlations.


So you have a huge improvement going to OPS, and then marginal improvement afterward. It's much more important to account for playing time than it is to get increased resolution from the advanced stats.

(Please note this is correlaton coefficient which means you need to square it to get the R^2 you are used to seeing)
I'm surprised to see SLG essentially equal with OBP, I had thought that OBP was the most predictive of the basic rate stats?

Anyway, OPS is fine, but I still prefer to see OBP/SLG separately, just because I have a much better sense of the scale. If I hear a guy has an OPS of .900, I have to think about that for a second, as opposed to an OBP of .370 and SLG of .530. where I instantly know that's a very good hitter. If I can only use one number, I'll go to OPS+, mostly because that's what's on b-ref.
 

Savin Hillbilly

loves the secret sauce
SoSH Member
Jul 10, 2007
18,783
The wrong side of the bridge....
Now think of that, and then think of the world of metrics in baseball. Some things measure clear and informative data. Batting average measures hits divided by at-bats. Whether we think it's a helpful stat or not, it does tell us something pretty clear. On the contrary, WAR is like a black box metric. I think it takes into account pretty much everything that a player does, but I have no idea how to calculate it.

So the question is, which stats or metrics do you find to be the most useful and informative? What are your "go-to" stats when evaluating a player? And what do you find to be some of the least useful or least informative metrics or stats?
I like wOBA/wRC+. But OPS/OPS+ does a decent back-of-the-envelope job of telling how well a hitter's doing.

BTW, I would dispute that batting average "tells us something pretty clear". Batting average tells us hits divided by at-bats--but why do I want to know that? How much does it tell me about a player's ability to help his team win? When I try to answer that question, I get tangled up in qualifications and caveats pretty quickly: it measures how often a player got on base when he didn't walk or get hit by a pitch. (But why should I ignore those other on-base events?) Or it measures how many hits a player was able to produce when the pitcher gave him a chance to. (But why not differentiate among those hits, since the doubles and triples are much more useful than the singles, and the homers much more useful than that?).

In short, BA is limited in pointless, arbitrary ways. It's very, very easy for Player X to have a batting average 50 points lower than Player Y and still be, unquestionably, the more productive hitter of the two. It happens every year (Anthony Rizzo, meet Dee Gordon). This is somewhat less likely to happen with SLG, even less likely to happen with OBP, and nearly impossible with OPS.

So BA is a clear statistic only in the sense of being easy to calculate. When I try to use it to understand the value a player has contributed, the clarity disappears.
 

Devizier

Member
SoSH Member
Jul 3, 2000
19,569
Somewhere
I never much liked OPS because it decreases precision with no corresponding gain in accuracy. In other words, Eddie Stanky and Mark Trumbo have similar career OPS but they could not be any more different as hitters. Linear weights definitely addresses the win contribution imbalance between OBP and SLG but you still lose a degree of descriptive power. And that's part of what's interesting, even if it doesn't inform you (directly) about how much player X contributes to his team's win total.
 

alwyn96

Member
SoSH Member
Aug 24, 2005
1,351
Maybe I'm old fashioned, but as far as rate stats go I think the good old triple slash line of AVG/OBP/SLG gives almost all you need about a hitter. You can tell if they're a banjo hitter or take and rake guy or something. It doesn't adjust for park of course, so then you need to go to wRC+ or OPS+, but if I'm looking at the stats of a hitter I know nothing about, the triple slash tells a nice little story, albeit with no idea of the context. I think plain old traditional ERA really isn't too bad either, as long as all you need to know is "is this guy lousy, decent, good, or great."

If we've gotta have one number to rule them all for "was this guy a good hitter or not?" I gotta go with wRC+ or OPS+ (and their pitching equivalents). To me, they're even simpler and more intuitive than OPS - they're indexed to 100, so I know what 100 means relative to other players, more or less. Plus it allows me to be lazy and not have to think too hard about context, and whether the hitter I'm looking at is hitting at Coors in 2002 or Petco in 2014 or something.

This does seem like kind of a funny discussion though, given that these days we probably have too many stats available to use.
 
Last edited:

BaseballJones

ivanvamp
SoSH Member
Oct 1, 2015
24,661
A stat I'd like to see developed is something along these lines. We know what ERA is. But what ERA doesn't tell us is how you get to ERA. Consider two pitchers with a similar ERA, but one gets there by consistently being solid but having one hideous, awful, catastrophic outing, while the other is consistently pretty meh. I'd rather have the good pitcher with one awful outing than the guy who is consistently pretty meh.

So is there a way to measure that? Like a "median" ERA or something like that? Or an ERA number compared to his median era? This is a site full of stat guys...one of you has to know how to do this.
 

smastroyin

simpering whimperer
Lifetime Member
SoSH Member
Jul 31, 2002
20,684
These discussions are always weird. I'm not sure what people are looking for in their stats. IK mentions BABIP and LD% which out of context tell you jack and fucking and shit about a player's contribution. But he's answering a different question than others when he is saying those are his preferred numbers. For the most part, I get the feeling that people are looking for a stat that helps them say "I choose player A over player B." But even this is fraught with issues. The biggest one is the idea of measuring past performance vs estimating future performance. The second one is the pure laziness. You know how you can take a look at a pitcher's run distribution? You click on a game log, which is available on every stats site.

In the end, this is my biggest problem with WAR, the enabling of lazy analysis by people who don't take the time to understand the first thing about what they are talking about, but also use it definitively. Put simply, knowing where to click on a website doesn't make you an analyst.

Regardless, there is also the question of utility. WPA was a fad for a while and you can still look it up and talk about it, but what people have largely found is that as it has little predictive value, and is of course entirely situation dependent, it's more a fun thing to look at ("most valuable player" in a short series, etc.) Similarly, there are situational statistics that you can look up but aren't widely published. Mostly because over time they even out. So while they might be interesting, there is no need to widely publish them and of course they are "contrived" because you have to come up with someone's definition of "close and late" or presume that there is something magical about bases empty or what have you (across the entire population).

So I guess what I'm saying is that I'm not 100% sure what you are looking for other than to wax poetic about wanting other people to create measurements that exempt you from thinking.
 

Buzzkill Pauley

Member
SoSH Member
Jun 30, 2006
10,569
So I guess what I'm saying is that I'm not 100% sure what you are looking for other than to wax poetic about wanting other people to create measurements that exempt you from thinking.
Looks like smas woke up on the grumpy side of the bed today!

To answer the OP, I prefer using straight-up AVG/OBP/SLG lines for both pitchers and hitters. I prefer measuring pitchers and hitters with the same stick, since it helps build a consistency of expectation over time. And since I don't play rotisserie/fantasy baseball I couldn't care less about measuring one player against another in a bubble. Stuff like ballpark factors I don't ever really think about, since questions like whether Pedroia would actually be a below-average hitter if he spent his career as a Mariner or Padre are entirely irrelevant to enjoying actual baseball games.

In cases where trying to think of who might be a "good fit" to play on one of the teams I follow, I'd rather assess game logs and spray charts over stats. Because then, it usually comes down to a comparison of two possible realities; statistically correcting one hitter or pitcher by presuming a neutralized hypothetical game environment just isn't that interesting to me, and the question of "who would be better" is always conditioned by the reality that the future can't be predicted.

That is, unless you're DeJesus.

But I try to remain relatively knowledgeable about whatever stats are "in fashion" at the moment, because it helps when trying to communicate, here and elsewhere.
 

Plympton91

bubble burster
SoSH Member
Oct 19, 2008
12,408
What's interesting to me is that for all the hand wringing and legitimate criticism of BA, using the most advanced stats only gives you about a 14% improvement in the correlation coefficient of team BA with team RS.

So as long as you're not talking about a huge outlier like Jose Iglesias, BA is usually telling you quite a lot.
 

Montana Fan

Member
SoSH Member
Oct 18, 2000
8,908
Twin Bridges, Mt.
As it relates to BA, I was perusing articles about Dom DiMaggio's hitting streak the other day and came across the article linked below. Dom's quote is a sign of the times but for us that came up in the 70's, that magic .300 line rings very true.

But the streak was over, and I didn’t mind that much. (After all, we’d won the game 6 to 3.) And hitting streaks didn’t matter to me, even when I hit in another 27 straight in 1951. It’s just a statistic. And the only statistic that really matters to me is hitting .300. I did it four times in my 10 full seasons in the major leagues, and finished with a .298 average lifetime. My only regret is not hitting .300.
http://bats.blogs.nytimes.com/2009/05/11/dom-dimaggio-on-his-own-34-game-hitting-streak/?_r=0
 

dbn

Member
SoSH Member
Feb 10, 2007
7,785
La Mancha.
I realized that putting CIs on stats like OPS is pretty trivial if you just do it computationally using, say, bootstrap resampling.

E.g., Jackie Bradley's OPS is 1.035 right now. The "one-sigma" confidence is +/- 0.119, and the 95% CIs are 0.807 and 1.276.

What does this mean?

Let's say that JBJ has some hypothetical "true ability" to produce singles, doubles, HRs, HBP, BBs, etc, that translates to a "true ability" OPS. We don't know what it is. Our best guess is what we calculate from the actual outcomes (i.e., the data). However, if there were some real "true ability level", we wouldn't expect the data to match the true ability levels exactly, because of statistical noise. By bootstrap resampling the data, we estimate that, within a 95% probability based on the observed data set, his "true ability level OPS" is between 0.807 and 1.276.

This does not mean that we can be 95% sure that his OPS over the entire season will be between 0.807 and 1.276, because his "true ability" level may change as he tires, get more experience, pitchers adjust, etc., etc.

edit: Ortiz is almost identical: 1.032 +/- 0.125, CIs 0.795 and 1.284
Ramirez: 0.823 +/- 0.096; 0.641 1.016
Xander: 0.883 +/- 0.091; 0.707 1.068
 
Last edited:

Cesar Crespo

79
SoSH Member
Dec 22, 2002
21,588
I always prefered the simple avg/obp/slug slashline, since as others have alluded to, it's really simple to add obp and slugging, so why do we need someone to actually do it for us? It's also far more informative.

As for pitches, WHIP and K/bb ratio. I also look at how many HRs they have allowed.
 

DJnVa

Dorito Dawg
SoSH Member
Dec 16, 2010
54,037
I never much liked OPS because it decreases precision with no corresponding gain in accuracy. In other words, Eddie Stanky and Mark Trumbo have similar career OPS but they could not be any more different as hitters.
I thought that was a feature, not a bug.
 

crystalline

Member
SoSH Member
Oct 12, 2009
5,771
JP
CIs on stats like OPS is pretty trivial if you just do it computationally using, say, bootstrap resampling.
Agreed the bootstrap is the right way to do this. The CI is likely to be a function only of sample size and the stat value, so if you wanted to get fancy I bet you could numerically estimate the function from (N,OPS) -> 95% CI.
In fact given that all the underlying events are Bernoulli/binomial I bet someone smarter than me could write down an analytical formula for that function. That's the sort of thing a physicist could do.
 

dbn

Member
SoSH Member
Feb 10, 2007
7,785
La Mancha.
Agreed the bootstrap is the right way to do this. The CI is likely to be a function only of sample size and the stat value, so if you wanted to get fancy I bet you could numerically estimate the function from (N,OPS) -> 95% CI.
In fact given that all the underlying events are Bernoulli/binomial I bet someone smarter than me could write down an analytical formula for that function. That's the sort of thing a physicist could do.
Oh, I see right through you crystalline. You bash physicists in one post and then try to make nice in another!

But yeah, my first thought was to do it analytically (which might be a fun exercise) before I realized how trivial it is with bootstrap.

I suspect the answer is "no", but if anyone wants some code for computing CIs for any stat, PM me. It's pretty simple and I could easily generalize what I already wrote in tens of minutes.
 

smastroyin

simpering whimperer
Lifetime Member
SoSH Member
Jul 31, 2002
20,684
My question is what does it tell us? JBJ isn't going to replay his last 25 games again. So what does a CI around his 25 game performance add? It's an honest question.

I don't mean to pooh pooh the work on any way. But I think it's important to understand the answers we are looking for. Otherwise we just end up with a really well defined 42
 

dbn

Member
SoSH Member
Feb 10, 2007
7,785
La Mancha.
That's not a "pooh pooh" at all, smas. By all means, ask away with stuff like that.

Tl;dr version: it doesn't tell us a whole lot (otherwise, someone would certainly have done this easy exercise before) but it does add a bit of perspective to the numbers.

Un-pedantic version: the data (i.e., his actualized results) suggest that at JBJ's current ability- and competition-level we can be 97.5% sure he's at least a 0.800 OPS guy and 97.5% sure that he's not more than a 1.280 OPS guy.

Slightly-pedantic version:
JBJ will go through periods of similar length (168 PAs) where he OPSes less/more than 1.035. The CIs tell us how much less/more OPS is less/more OPS enough that we can be 97.5% sure that statistical randomness isn't all to blame - i.e., that his skill and/or the ability of the opposition-pitching to get him out has changed. The non-stastitical randomness could be due to health, the league figuring him out, he figuring the league out, age-related improvement or decline, etc., etc., etc.

The rub is that all of those non-stastitical affects *will* happen to greater or lesser degrees, as *will* purely statistical variations, and there are no easy ways to disentangle them. Actually, the best way to try to untangle them a bit is to watch JBJ play baseball and see if we notice anything not in the data.

One final important note:
There is nothing magical about the 95 in a 95% CI. I also listed the "1-sigma" uncertainty which tells you something about a 68% CI and is something that is very commonly used in science. Again, it's all about adding perspective.
 

dbn

Member
SoSH Member
Feb 10, 2007
7,785
La Mancha.
One more thought that may be a better way of explaining it.

If JBJ soon turns into a consistently 0.750-OPS hitter, we should conclude either of or a combination of two (at least) things. First, that his 168 PAs so far this season was a statistical outlier at the > 97.25% level. Second, that the state that existed over those 168 PAs has significantly changed; by "state" I mean the combination of his ability to hit and the ability of pitchers to get him out.

I could run the same analysis for all of his MLB PAs prior to 2016. I expect that the result would be that a 1.035 OPS was beyond a 95% CI. That means that the 2016-so-far numbers are either an outlier at the > 97.25% level, or that (more likely, we all hope) that the "state" has changed.
 
Last edited:

StupendousMan

Member
SoSH Member
Jul 20, 2005
1,925
In fact given that all the underlying events are Bernoulli/binomial I bet someone smarter than me could write down an analytical formula for that function. That's the sort of thing a physicist could do.
Did someone ask for a physicist?

You can use the Binomial Distribution to compute the probability that a batter with an average of "p" gets exactly "k" hits in "n" trials.


In order to place confidence intervals on his performance, you can use the Cumulative Distribution Function. Evaluate the following to find the number of hits which yield probabilities of, say, 5% and 95%, to find the "two-sigma" confidence interval around his expected number of hits.


crystalline

Member
SoSH Member
Oct 12, 2009
5,771
JP
Did someone ask for a physicist?

You can use the Binomial Distribution to compute the probability that a batter with an average of "p" gets exactly "k" hits in "n" trials.


In order to place confidence intervals on his performance, you can use the Cumulative Distribution Function. Evaluate the following to find the number of hits which yield probabilities of, say, 5% and 95%, to find the "two-sigma" confidence interval around his expected number of hits.

Yes, nice.

For finding an analytical formula for OPS CIs:

SLG and OBP are not entirely independent so you probably need to consider joint distributions. Also since there is more than one hit outcome from a PA (double, single, HR, etc.) I suspect you need more than a binomial to do this for the SLG component.
 

glasspusher

Member
SoSH Member
Jul 20, 2005
9,973
Oakland California
The thing with OPS is that it is simple to compute and correlates well on a team level with run scoring.

Here's a link to a Hardball times article about various correlations.


So you have a huge improvement going to OPS, and then marginal improvement afterward. It's much more important to account for playing time than it is to get increased resolution from the advanced stats.
Nice graph, but I think it would be better if the y axis went down to zero. Kind of makes BB look useless. Yes, I'm a graph stickler. Clarity! Interesting information, nonetheless. Should I post a better graph with the same data?
 

smastroyin

simpering whimperer
Lifetime Member
SoSH Member
Jul 31, 2002
20,684
I didn't create the graph, but do what you like.

One more thought that may be a better way of explaining it.

If JBJ soon turns into a consistently 0.750-OPS hitter, we should conclude either of or a combination of two (at least) things. First, that his 168 PAs so far this season was a statistical outlier at the > 97.25% level. Second, that the state that existed over those 168 PAs has significantly changed; by "state" I mean the combination of his ability to hit and the ability of pitchers to get him out.

I could run the same analysis for all of his MLB PAs prior to 2016. I expect that the result would be that a 1.035 OPS was beyond a 95% CI. That means that the 2016-so-far numbers are either an outlier at the > 97.25% level, or that (more likely, we all hope) that the "state" has changed.
Right, so, thank you. FTR I understand CI's very well but I wanted an explanation for others to read.

But now, my question is, what would we have to do to use CI's as an analytical tool? Right, in a really rough sense we could say that over the past 25 games, there is a 30% chance that JBJ's actual "talent" level exceeding David Ortiz's (I just made up that number and I am simplifying the statement purposefully). But I'm not sure that's particularly interesting in and of itself. A CI around what has already happened doesn't tell us too much. What happened has happened and we don't get the chance to play the games over and over. In this sense, there is no CI around JBJ's last 25 game OPS. It is exactly what it is. So if you are trying to get at his "talent level OPS" (tlOPS) over the past 25 games, what can that tell us for a prediction of his next 25 games? If we are 95% certain that his "tlOPS" *was* between .800 and 1.280 then how wide do we get when we talk about a 95% CI prediction of his next 25/50/100 games? Without running the actual computation I would guess that a 600 OPS over the next 25 games would fall within the model. But so would a 1250. And that's basically the entire range of OPS in MLB.
 

dbn

Member
SoSH Member
Feb 10, 2007
7,785
La Mancha.
Why 25 games? If indeed the CIs say that over the next 25 games we can be reasonably sure that his OPS will be between 600 and 1250, it tells us something indeed: we shouldn't read too much into a 25-game sample. I mean, that's exactly the type of information we are trying to get with CIs.

If I find some time soon I'll play around with this stuff and see if I can't make some interesting plots (n.b.: the answer might be that I can't).
 

StupendousMan

Member
SoSH Member
Jul 20, 2005
1,925
In theory, we can figure out how predictive any various measure is
  1. devise metric
  2. apply it to player(s) over period of N games in past
  3. make predictions for next N games
  4. look at actual performances over those next N games

Any volunteers?
 

shaggydog2000

Member
SoSH Member
Apr 5, 2007
11,561
I didn't create the graph, but do what you like.


Right, so, thank you. FTR I understand CI's very well but I wanted an explanation for others to read.

But now, my question is, what would we have to do to use CI's as an analytical tool? Right, in a really rough sense we could say that over the past 25 games, there is a 30% chance that JBJ's actual "talent" level exceeding David Ortiz's (I just made up that number and I am simplifying the statement purposefully). But I'm not sure that's particularly interesting in and of itself. A CI around what has already happened doesn't tell us too much. What happened has happened and we don't get the chance to play the games over and over. In this sense, there is no CI around JBJ's last 25 game OPS. It is exactly what it is. So if you are trying to get at his "talent level OPS" (tlOPS) over the past 25 games, what can that tell us for a prediction of his next 25 games? If we are 95% certain that his "tlOPS" *was* between .800 and 1.280 then how wide do we get when we talk about a 95% CI prediction of his next 25/50/100 games? Without running the actual computation I would guess that a 600 OPS over the next 25 games would fall within the model. But so would a 1250. And that's basically the entire range of OPS in MLB.
Measuring a baseball player's performance and then estimating a true talent level is very hard. The variance/confidence interval method shown above is a good start, but it assumes that a time period the data is from is representative of the whole data set that could exist. This isn't necessarily true. Like dbn said, it's representative of the sampled state. If pitchers tomorrow started pitching JBJ differently, it could change. If he changes something in his approach, consciously or not, it could change. If he gets hurt, etc. With young players, they develop and the older data is not representative of who they are now. And older players decline and old data is not representative of their current state. What I would be more comfortable saying is that the confidence interval tells us about the player's true talent level during the period sampled. Add that to what you know of the player's history surrounding that time period, and you can make some guesses about how he will perform in the future. I think for certain players, standard deviations could tell you how streaky they were, and with a season long sample of data, you may be able to compare the estimated true talent level during that year.
 

smastroyin

simpering whimperer
Lifetime Member
SoSH Member
Jul 31, 2002
20,684
25 games was just an arbitrary choice.

I'm not trying to be overly critical, but you guys specifically said you would want to see CIs published with OPS and other stats. I am having a lot of trouble understanding the point of doing so other than to reinforce sample size issues. OPS measures what has already happened. It's not hypothesis testing, it's not really an estimate of a larger population (again, we can't recreate the conditions of the past, though we can hope things even out in the longer run). You yourself have said that true talent level itself varies (streak/slump effects, natural career arc progression, weather, home/road, strength of opponent) and I agree with you.

I want to state this again. Because I'm not sure I'm making my point. Let's take a sample of 500 PA. A player has a .250/.350/.450 line over those 500 PA. His OPS WAS 800. That's what it was, we've measured something that happened. So what are you putting CI around? What are you trying to estimate? Since we don't replay the seasons over and over, I'm not sure what the utility of calculating CI's around the 500 PA is, unless it is to try and estimate the future 500/1000/2500 whatever you want to say the "population" is that the 500 PA represents a sample of.

So I can see making models to kind of figure out where statistics typically stabilize. I can see putting CI's on predictions. I can also see perhaps around calculated statistics. It would be lovely to understand the CI of, say, defensive runs so that we don't make gigantic leaps. Why do I feel this way, because again, we aren't taking a direct measurement of things that actually happened, so we have a hypothetical model of value. Putting CIs around how accurately that is estimated makes sense to me on a more fundamental level than trying to do so around actual measured events.
 

joe dokes

Member
SoSH Member
Jul 18, 2005
30,542
In the context in which it has gained currency, OPS is probably better than the long-exalted BA alone.

OPS+ tells me more, since what's good or bad changes annually (except at the margins). Mostly, though, as a couple of others have said, BA/OBP/SLG tells me what I want to know *right now* about a hitter (or the "againsts" for a pitcher).
 

crystalline

Member
SoSH Member
Oct 12, 2009
5,771
JP
So what are you putting CI around? What are you trying to estimate?
The CI tells you how repeatable the measured OPS is. If JBJ has an OPS of 1.000 over 30 games with 95% CI 0.400-1.800, the reader immediately knows that those 30 games say nothing about his ability to repeat the OPS over the next 30 games. And if he OPS's 0.900 over 162 games and the 95% CI is 0.850-0.950, his chances of repeating the OPS the next year is much higher. (Subject to assumptions about the underlying talent level and circumstances being unchanged, of course, but this is still useful information.) Just adding that information would eliminate a good fraction of arguments about statistics on the main board.


Measuring a baseball player's performance and then estimating a true talent level is very hard.
Yes, it's hard.
But estimating true underlying levels from measured performance is so useful and important, from medicine to weather to earthquakes to baseball, that there is an entire field ("Statistics") dedicated to that task.

And you could argue that the industry that's grown up around analytics, machine learning, and big data also depends on that task. It's hard, but it's not impossible. And it's much more possible in baseball than football.
 

shaggydog2000

Member
SoSH Member
Apr 5, 2007
11,561
The CI tells you how repeatable the measured OPS is. If JBJ has an OPS of 1.000 over 30 games with 95% CI 0.400-1.800, the reader immediately knows that those 30 games say nothing about his ability to repeat the OPS over the next 30 games. And if he OPS's 0.900 over 162 games and the 95% CI is 0.850-0.950, his chances of repeating the OPS the next year is much higher. (Subject to assumptions about the underlying talent level and circumstances being unchanged, of course, but this is still useful information.) Just adding that information would eliminate a good fraction of arguments about statistics on the main board.


Yes, it's hard.
But estimating true underlying levels from measured performance is so useful and important, from medicine to weather to earthquakes to baseball, that there is an entire field ("Statistics") dedicated to that task.

And you could argue that the industry that's grown up around analytics, machine learning, and big data also depends on that task. It's hard, but it's not impossible. And it's much more possible in baseball than football.
I agree that it's definitely worth doing. I just wanted to caution people who may not be as stats educated about samples needing to be representative in order to be used to make predictions. And I added situations where data may or may not be representative of the current or future state. As long as you're aware of how the process works and you account for that factor, you're cool by me. I have actually advocated before on this board for standard deviations being included with stats, both so that you could bound the error of the stat, but also to finally be able to say who is and isn't a "streaky" player. Because people toss that around a lot, but I never see the statistical analysis to back it up.
 

BaseballJones

ivanvamp
SoSH Member
Oct 1, 2015
24,661
In terms of my idea about a median era and comparing it to a pitcher's regular era, I'm thinking it may be, over the long haul, a helpful way to know if a pitcher is consistently good/bad, or if it's mainly a handful of blowups (or if they're generally bad, a handful of sterling outings) that skew the numbers. So take the four primary starters in the Sox' rotation this year (8 games started minimum). Here they are, their total ERA, their median ERA, and the difference between their ERA and median ERA.

Porcello (9 g) - 3.47 era, 3.86 mERA, -0.39
Price (9 g) - 5.53 era, 3.00 mERA, +2.53
Wright (8 g) - 2.52 era, 2.18 mERA, +0.35
Buchholz (9 g) - 5.92 era, 7.50 mERA, -1.58

So this would tell us that Porcello has pitched, on average, pretty close to his ERA. So either his bad outings have equaled his good outings, or he's been consistently around that number. Price's actual ERA is significantly higher than his mERA. Why is that? Because he's had 4 awful outings - including one beyond hideous one. Wright has been pretty close. And Clay's ERA is actually much lower than his mERA. That's because in a whole pile of garbage, he's had two really good outings.

Over the course of a season (or a career), could something like this be useful? Is there a better way of putting something like this together?
 

tims4wins

PN23's replacement
SoSH Member
Jul 15, 2005
37,328
Hingham, MA
In terms of my idea about a median era and comparing it to a pitcher's regular era, I'm thinking it may be, over the long haul, a helpful way to know if a pitcher is consistently good/bad, or if it's mainly a handful of blowups (or if they're generally bad, a handful of sterling outings) that skew the numbers. So take the four primary starters in the Sox' rotation this year (8 games started minimum). Here they are, their total ERA, their median ERA, and the difference between their ERA and median ERA.

Porcello (9 g) - 3.47 era, 3.86 mERA, -0.39
Price (9 g) - 5.53 era, 3.00 mERA, +2.53
Wright (8 g) - 2.52 era, 2.18 mERA, +0.35
Buchholz (9 g) - 5.92 era, 7.50 mERA, -1.58

So this would tell us that Porcello has pitched, on average, pretty close to his ERA. So either his bad outings have equaled his good outings, or he's been consistently around that number. Price's actual ERA is significantly higher than his mERA. Why is that? Because he's had 4 awful outings - including one beyond hideous one. Wright has been pretty close. And Clay's ERA is actually much lower than his mERA. That's because in a whole pile of garbage, he's had two really good outings.

Over the course of a season (or a career), could something like this be useful? Is there a better way of putting something like this together?
Well another way you can look at it is standard deviation.

For instance, Price has a 5.53 ERA with a standard deviation of 6.06
Buchholz has a 5.92 ERA with a standard deviation of 3.43
Porcello has a 3.47 ERA with a standard deviation of 2.39

This tells us that:
Price has mostly been very good, or pretty bad, with little in between
Buch has been consistently bad with very little good
Porcello has been consistently good with little variance
 

dbn

Member
SoSH Member
Feb 10, 2007
7,785
La Mancha.
Okay, fun with graphs time.

I picked the first player I could think of that, to my memory, was a pretty consistent hitter over the course of a season: Bill Mueller in 2003. Here is his cumulative game-to-game OPS with 1- and 3-sigma CIs.


Indeed, he was pretty consistent. There are various ways to look at this. I put the dashed line in at his season-total OPS. Even after the first few weeks, even the 1-sigma bounds pretty much contain the <OPS>. Another way to look at it would be focusing on a given CI at a given date and seeing if the OPS going forward ever gets above/below that level. It doesn't, which again indicates the Billy M was consistently good that season.

Now let's look at Hanley Ramirez in 2015.


Different story. He started hot then cooled off. Well, we know something about Hanley's 2015 that the data doesn't: he ran into the LF wall and injured his shoulder on May 5th (or whenever it was). Let's look at his season post-wall running into.


More consistent and generally stays within the CIs.

Let's now look at them together:


His post-running into the wall <OPS> is right around the lower 2-sigma CI when he literally hit the wall. This suggests that there is a good chance the change wasn't all just chance, but that the injury might have had some real affect on him (physically, mentally, both...). Note that I also put a dashed line at his <OPS> the day he ran into the wall. I suspect that if I redid the plot in opposite time-order, that 0.949 OPS would be ruled out by the pre-wall CIs, again suggesting that there was a real effect there. edit: actually, we can see that by looking at the 2-sigma CIs from the post-wall data.
 

BaseballJones

ivanvamp
SoSH Member
Oct 1, 2015
24,661
Well another way you can look at it is standard deviation.

For instance, Price has a 5.53 ERA with a standard deviation of 6.06
Buchholz has a 5.92 ERA with a standard deviation of 3.43
Porcello has a 3.47 ERA with a standard deviation of 2.39

This tells us that:
Price has mostly been very good, or pretty bad, with little in between
Buch has been consistently bad with very little good
Porcello has been consistently good with little variance
I'm not a statistician of any kind, and most people who look at baseball stats aren't either. So I get what standard deviation is, but if you looked at that number, would it be more helpful than comparing it to the median? (I'm sure the answer is yes, but why?)
 

dbn

Member
SoSH Member
Feb 10, 2007
7,785
La Mancha.
BaseballJones, I'm glad you brought up median values because I've also often wished to see medians used more in sports data reporting. Usually in football for yards per carry. I haven't looked at the YPC distributions but I suspect that a median would be much more informative.
 

BaseballJones

ivanvamp
SoSH Member
Oct 1, 2015
24,661
BaseballJones, I'm glad you brought up median values because I've also often wished to see medians used more in sports data reporting. Usually in football for yards per carry. I haven't looked at the YPC distributions but I suspect that a median would be much more informative.
Consider two RBs and their yards on each individual carry.

Smith: 1, 3, 0, 5, 7, 3, 3, 5, 4, 7, 3, 6, 6, 8, 5, 4, 4, 2, 5, 3, 4 = 21 rushes, 92 yards, 4.38 YPC, 4 mYPC
Jones: -2, 0, 1, -2, -1, 3, 0, 0, -1, -3, 3, 5, 4, 2, 1, -1, 2, 2, 1, 78 = 21 rushes, 92 yards, 4.38 YPC, 1 mYPC

You know Smith is basically getting a little over 4 yards per carry. Jones is basically getting stuffed every time, but had one monster run that accounted for his yards. Two final stat lines (21 rushes, 92 yards, 4.38 YPC), but two completely different ways to get there. The traditional stats in this case just don't really tell you nearly as much as a YPC vs. mYPC comparison could.
 

shaggydog2000

Member
SoSH Member
Apr 5, 2007
11,561
I'm not a statistician of any kind, and most people who look at baseball stats aren't either. So I get what standard deviation is, but if you looked at that number, would it be more helpful than comparing it to the median? (I'm sure the answer is yes, but why?)
If you're interested in knowing how a player's performance varied, standard deviation is exactly what you'd want to look at. The number is basically a measurement of the variation and "spread" of the data. If the data is bunched closely together, the standard deviation will be low. If the data varies all over the place, then the standard deviation will be high. The median is useful to get an idea of what outcome is in the middle of all the outcomes, which could be significantly different from the average outcome. By comparing them you would get some information, but I don't think it would be exactly what you're looking for. I guess it would filter out high and low outliers where a guy got bombed or had an uncommonly good day, but the median doesn't tell you much about the distribution on either side of it.
 

shaggydog2000

Member
SoSH Member
Apr 5, 2007
11,561
Consider two RBs and their yards on each individual carry.

Smith: 1, 3, 0, 5, 7, 3, 3, 5, 4, 7, 3, 6, 6, 8, 5, 4, 4, 2, 5, 3, 4 = 21 rushes, 92 yards, 4.38 YPC, 4 mYPC
Jones: -2, 0, 1, -2, -1, 3, 0, 0, -1, -3, 3, 5, 4, 2, 1, -1, 2, 2, 1, 78 = 21 rushes, 92 yards, 4.38 YPC, 1 mYPC

You know Smith is basically getting a little over 4 yards per carry. Jones is basically getting stuffed every time, but had one monster run that accounted for his yards. Two final stat lines (21 rushes, 92 yards, 4.38 YPC), but two completely different ways to get there. The traditional stats in this case just don't really tell you nearly as much as a YPC vs. mYPC comparison could.
In this case, I think you're missing a number or 2 in there, but I had

Smith with 21 carries for 88 Yards, a 4.2 average, and a 1.94 std Deviation
Jones had 20 carries for 92 Yards, a 4.6 average, and 16.96 std Deviation

So you can see that Smith was much more consistent, and that Jones had a std. Dev way beyond his mean, which would make it pretty useless for predicting his real talent level or future performance. If you needed two yards, I'd give it to Smith.
 

dbn

Member
SoSH Member
Feb 10, 2007
7,785
La Mancha.
Jones: right, of course, but that is an example contrived to show what might make medians interesting. It might turn out that when you look at the data from actual real NFL RBs, median might not tell you much. I suspect that it is more informative than avg, but I'm not sure.

dog2000: the stddev for Jones doesn't have much meaning because it's skewed by an outlier. His "typical" YPC don't vary by 17 yds. In that example, stddev tells you immediately that something is atypical about the data, but very little about what Jones' YPC distribution looks like. Most people think of stddev as the "sigma" in a Gaussian distribution.

Anyhow, fun discussion, I hope it keeps going.
 

crystalline

Member
SoSH Member
Oct 12, 2009
5,771
JP
Now let's look at Hanley Ramirez in 2015.
Nice.

It would also be interesting to see the same plot but with CIs estimated in running windows. Choose 50-100 PA bins, find OPS and CIs via bootstrap, slide the bin along a few PAs, and repeat. You could then smooth the resulting time series - a lowess smoother probably performs the best for data like this. That would get at the question of how consistent a hitter is across games.
 

Rovin Romine

Johnny Rico
Lifetime Member
SoSH Member
Jul 14, 2005
24,408
Miami (oh, Miami!)
These discussions are always weird. I'm not sure what people are looking for in their stats. (snip) For the most part, I get the feeling that people are looking for a stat that helps them say "I choose player A over player B." (snip)
Not to sound flippant, but to return to basic principles, I think the average person is looking for a measure of how well a guy is performing.

In Ye Olden Days, BA was pretty simple in that regard - .200 is the Mendoza Line and .300 plus is All Starish. I remember when I first came across OPS - I thought "cool - but I have no emotional understanding of what these numbers mean, the way I do for a guy hitting .340. I still feel that way occasionally, when running into something like "Dude, the guy's FARKIFIPFSH is 1.456!"